In today’s entry, I am simply trying to remember how patchwork handles titles of each graph and an overall graph.
library("patchwork")
library("tidyverse")
── Attaching packages ─────────────────────────────────────── tidyverse 1.3.1 ──
✔ ggplot2 3.3.6     ✔ purrr   0.3.4
✔ tibble  3.1.8     ✔ dplyr   1.0.9
✔ tidyr   1.2.0     ✔ stringr 1.4.1
✔ readr   2.1.2     ✔ forcats 0.5.1
── Conflicts ────────────────────────────────────────── tidyverse_conflicts() ──
✖ dplyr::filter() masks stats::filter()
✖ dplyr::lag()    masks stats::lag()
correlatedValues = function(x, r = 0.9){
  r2 = r**2
  ve = 1-r2
  SD = sqrt(ve)
  e  = rnorm(length(x), mean=0, sd=SD)
  y  = r*x + e
  return(y)
}
Earlier tonight, I was making these plots for a quick lecture about correlation, so let me just grab some copies.
x <- rnorm(100, mean = 0, sd = 1)
y <- correlatedValues(x, r = -0.9)

cor_value <- cor(x,y, use = "pairwise.complete.obs")

df_for_graph <- data.frame(x,y)
p1 <- df_for_graph |>
  ggplot(aes(x = x, y = y)) +
  geom_point() +
  labs(title = "Correlation Example",
       subtitle = paste0("r = ", round(cor_value, 4),
                         ", strongly and negatively correlated"),
       caption = "Spark 01")
x <- rnorm(100, mean = 0, sd = 1)
y <- correlatedValues(x, r = -0.5)

cor_value <- cor(x,y, use = "pairwise.complete.obs")

df_for_graph <- data.frame(x,y)
p2 <- df_for_graph |>
  ggplot(aes(x = x, y = y)) +
  geom_point() +
  labs(title = "Correlation Example",
       subtitle = paste0("r = ", round(cor_value, 4),
                         ", slightly and negatively correlated"),
       caption = "Spark 01")
x <- rnorm(100, mean = 0, sd = 1)
y <- correlatedValues(x, r = 0)

cor_value <- cor(x,y, use = "pairwise.complete.obs")

df_for_graph <- data.frame(x,y)
p3 <- df_for_graph |>
  ggplot(aes(x = x, y = y)) +
  geom_point() +
  labs(title = "Correlation Example",
       subtitle = paste0("r = ", round(cor_value, 4),
                         ", virtually uncorrelated"),
       caption = "Spark 01")
x <- rnorm(100, mean = 0, sd = 1)
y <- correlatedValues(x, r = 0.5)

cor_value <- cor(x,y, use = "pairwise.complete.obs")

df_for_graph <- data.frame(x,y)
p4 <- df_for_graph |>
  ggplot(aes(x = x, y = y)) +
  geom_point() +
  labs(title = "Correlation Example",
       subtitle = paste0("r = ", round(cor_value, 4),
                         ", slightly and positively correlated"),
       caption = "Spark 01")
x <- rnorm(100, mean = 0, sd = 1)
y <- correlatedValues(x, r = 0.9)

cor_value <- cor(x,y, use = "pairwise.complete.obs")

df_for_graph <- data.frame(x,y)
p5 <- df_for_graph |>
  ggplot(aes(x = x, y = y)) +
  geom_point() +
  labs(title = "Correlation Example",
       subtitle = paste0("r = ", round(cor_value, 4),
                         ", strongly and positively correlated"),
       caption = "Spark 01")
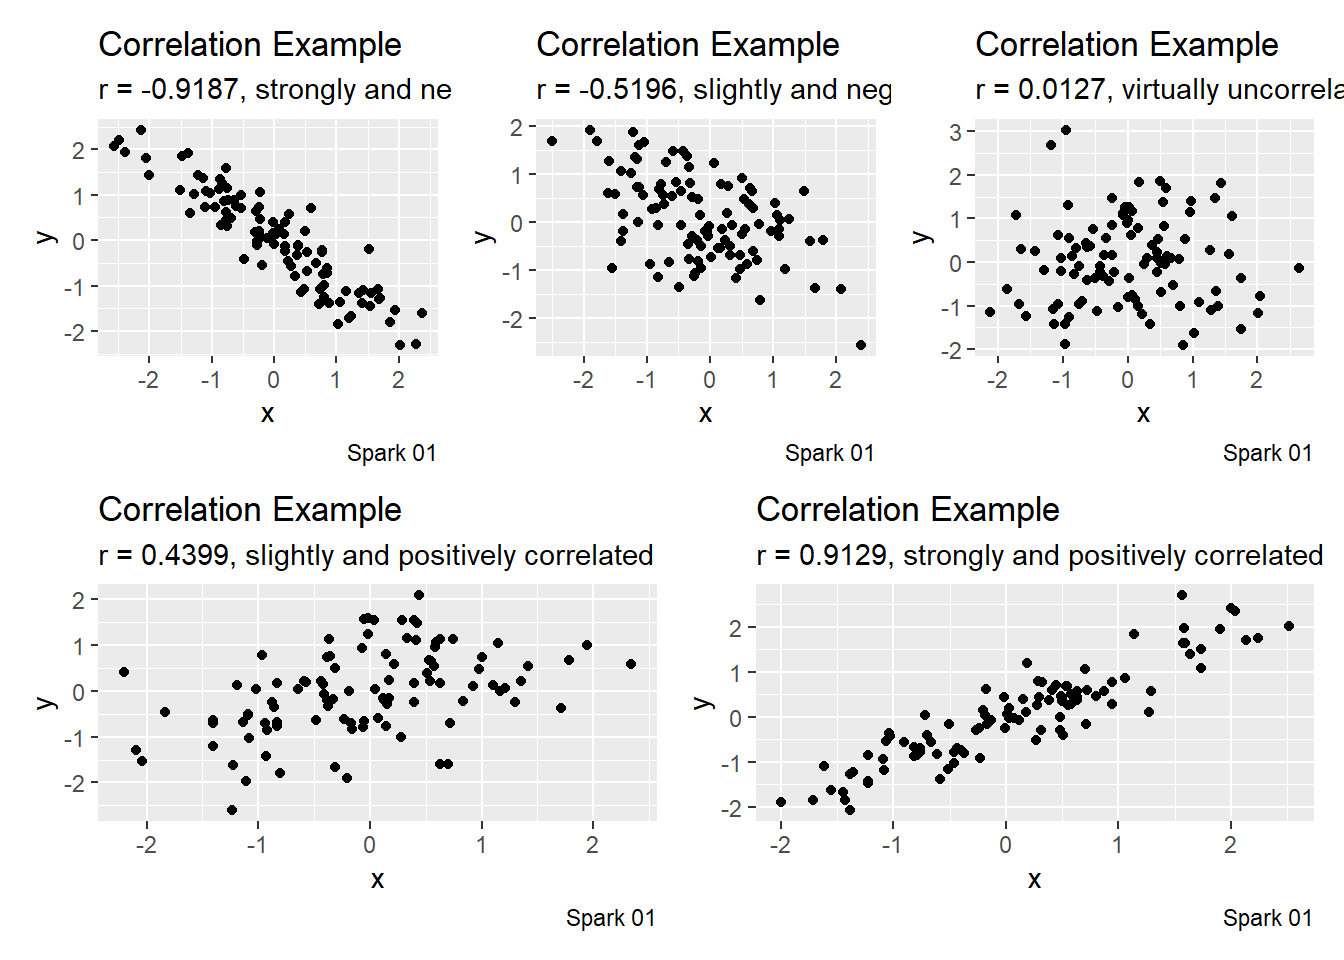
Now for the patchwork
#patchwork
(p1 + p2 + p3) / (p4 + p5)
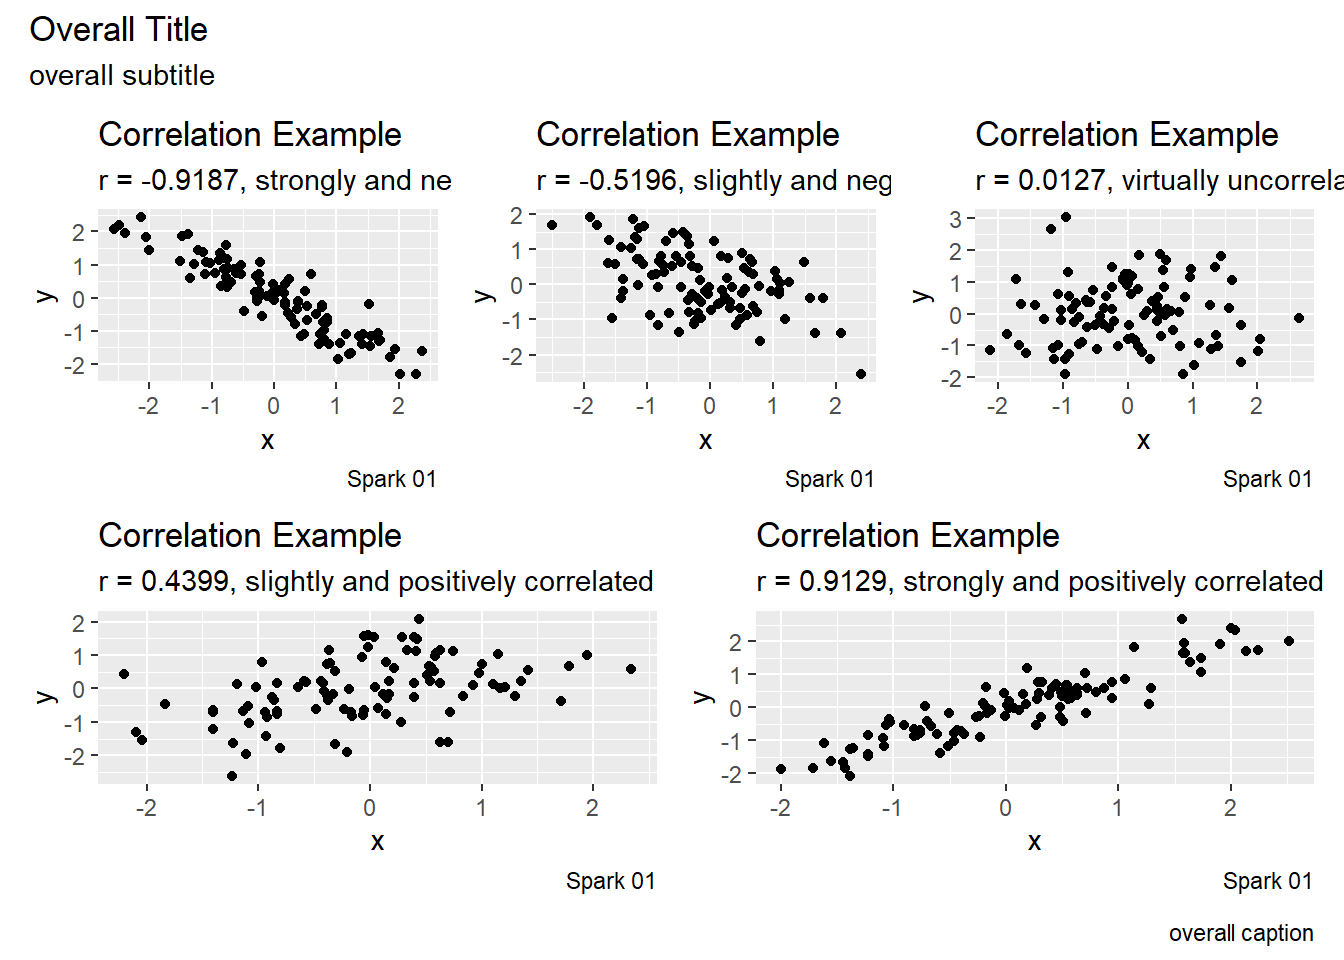
Now for the annotation.
overall_plot <- (p1 + p2 + p3) / (p4 + p5)

overall_plot + plot_annotation(
  title = "Overall Title",
  subtitle = "overall subtitle",
  caption = "overall caption"
)
Great! Everything is working as planned.