library("dplyr")
library("ggplot2")There are probably several ways to graph mathematical inequalities in R. Here, I will simply try a brute force method of literally plotting many dots.
Here, I will simply try a brute force method of literally plotting many dots.
N <- 100 #resolution
x <- seq(-10, 10, length.out = N)
y <- seq(-10, 10, length.out = N)

df <- expand.grid(x,y)
colnames(df) <- c("xval", "yval")
Today’s tasks come from chapter 9 of the popular ISLR textbook
Conceptual Task 1a
df1 <- df |>
  # math function
  mutate(shade = ifelse(yval > 3*xval + 1, "blue", "red"))
df1 |>
ggplot() +
# shaded regions
geom_point(aes(x = xval, y = yval, color = shade),
alpha = 0.5) +
scale_color_identity() +
# axes
geom_segment(aes(x = -10, y = 0, xend = 10, yend = 0),
alpha = 0.25, color = "gray75", linewidth = 2) +
geom_segment(aes(x = 0, y = -10, xend = 0, yend = 10),
alpha = 0.25, color = "gray75", linewidth = 2) +
# main line
geom_segment(aes(x = -(11/3), y = -10, xend = 3, yend = 10),
color = "black", linewidth = 3) +
# customization
coord_equal() +
labs(title = "Separating Hyperplane",
subtitle = "y = 3x + 1",
caption = "ISLR",
x = "X1", y = "X2") +
theme_minimal()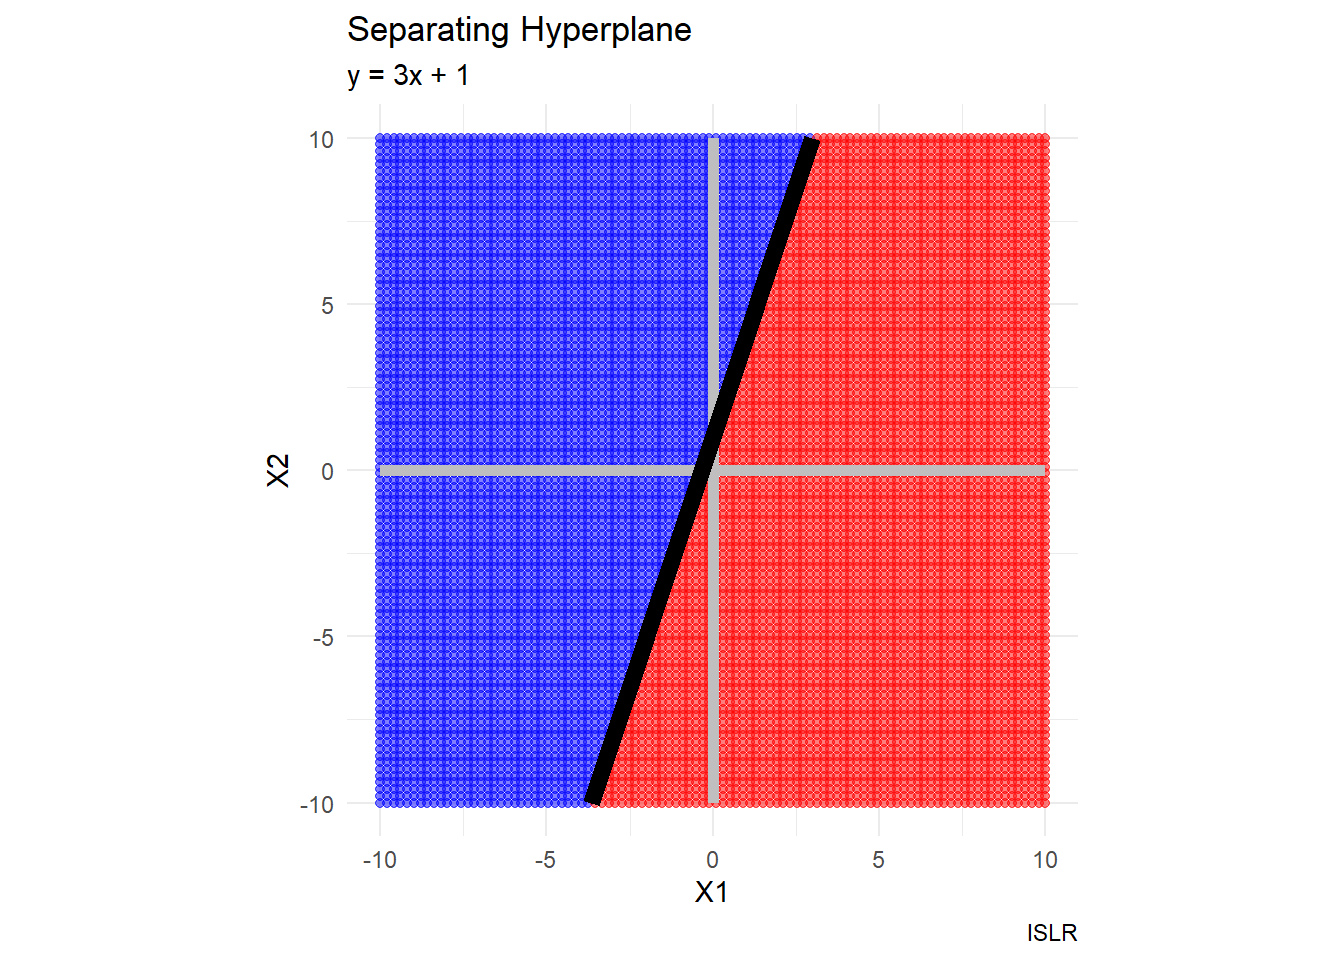
Conceptual Task 1b
df1b <- df |>
  # math function
  mutate(shade = ifelse(yval > 1 - 0.5*xval, "blue", "red"))
df1b |>
ggplot() +
# shaded regions
geom_point(aes(x = xval, y = yval, color = shade),
alpha = 0.5) +
scale_color_identity() +
# axes
geom_segment(aes(x = -10, y = 0, xend = 10, yend = 0),
alpha = 0.25, color = "gray75", linewidth = 2) +
geom_segment(aes(x = 0, y = -10, xend = 0, yend = 10),
alpha = 0.25, color = "gray75", linewidth = 2) +
# main line
geom_segment(aes(x = -10, y = 6, xend = 10, yend = -4),
color = "black", linewidth = 3) +
# customization
coord_equal() +
labs(title = "Separating Hyperplane",
subtitle = "y = 1 - 0.5x",
caption = "ISLR",
x = "X1", y = "X2") +
theme_minimal()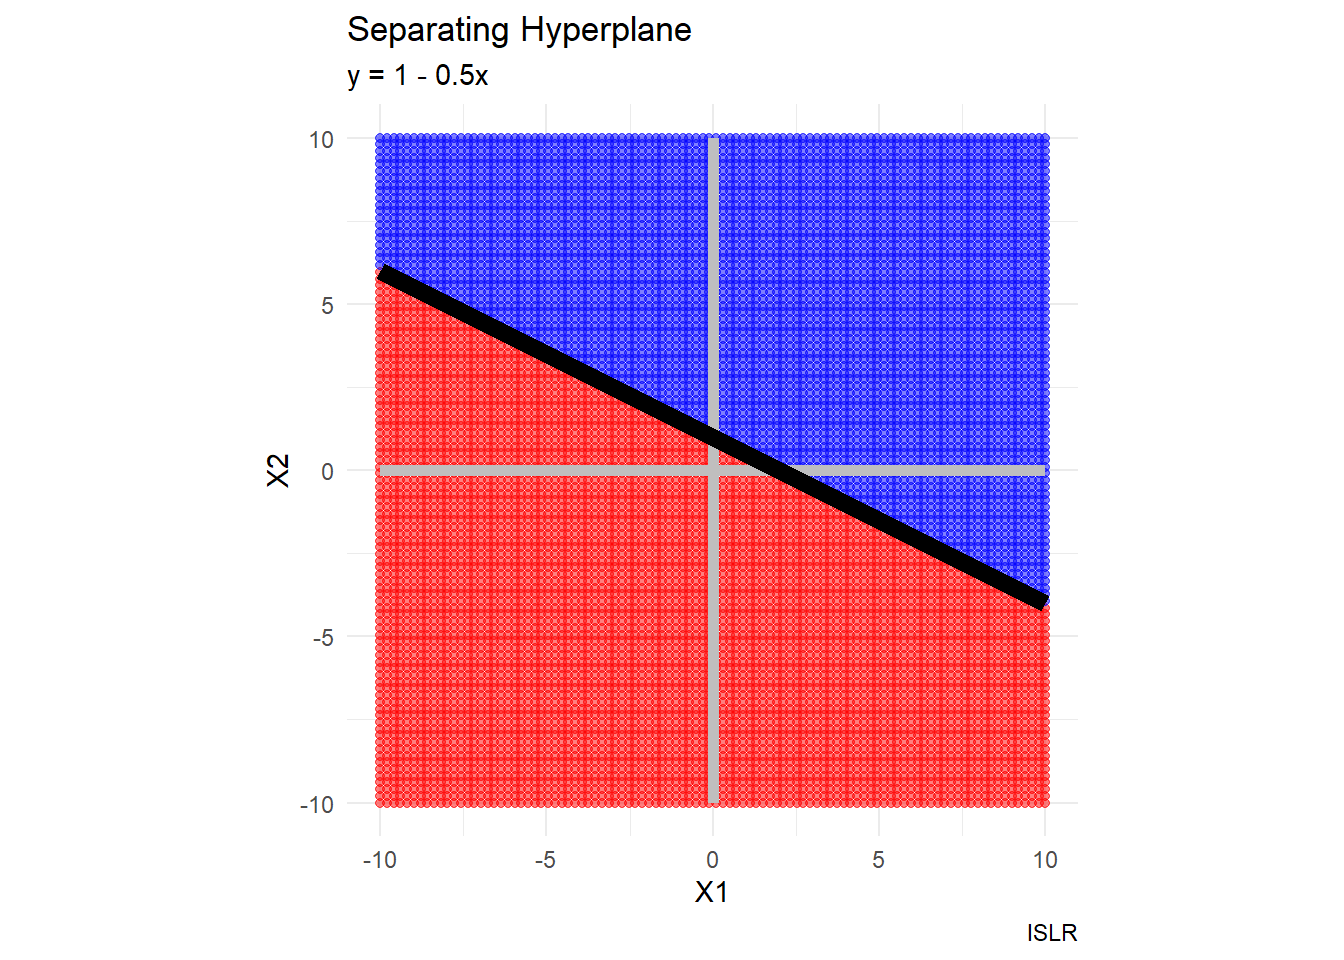
Conceptual Task 2
euclidean_distance <- function(x1, y1, x2, y2){
  # computes the Euclidean distance between (x1, y1) and (x2, y2)
  sqrt( (x2 - x1)^2 + (y2 - y1)^2 )
}
df2 <- df |>
# math function
mutate(shade = ifelse(euclidean_distance(xval, yval, -1, 2) > 4,
"blue", "red"))df2 |>
ggplot() +
# shaded regions
geom_point(aes(x = xval, y = yval, color = shade),
alpha = 0.5) +
scale_color_identity() +
# axes
geom_segment(aes(x = -10, y = 0, xend = 10, yend = 0),
alpha = 0.25, color = "gray75", linewidth = 2) +
geom_segment(aes(x = 0, y = -10, xend = 0, yend = 10),
alpha = 0.25, color = "gray75", linewidth = 2) +
# customization
coord_equal() +
labs(title = "Separating Hyperplane",
subtitle = "(x+1)^2 + (y-2)^2 = 4",
caption = "ISLR",
x = "X1", y = "X2") +
theme_minimal()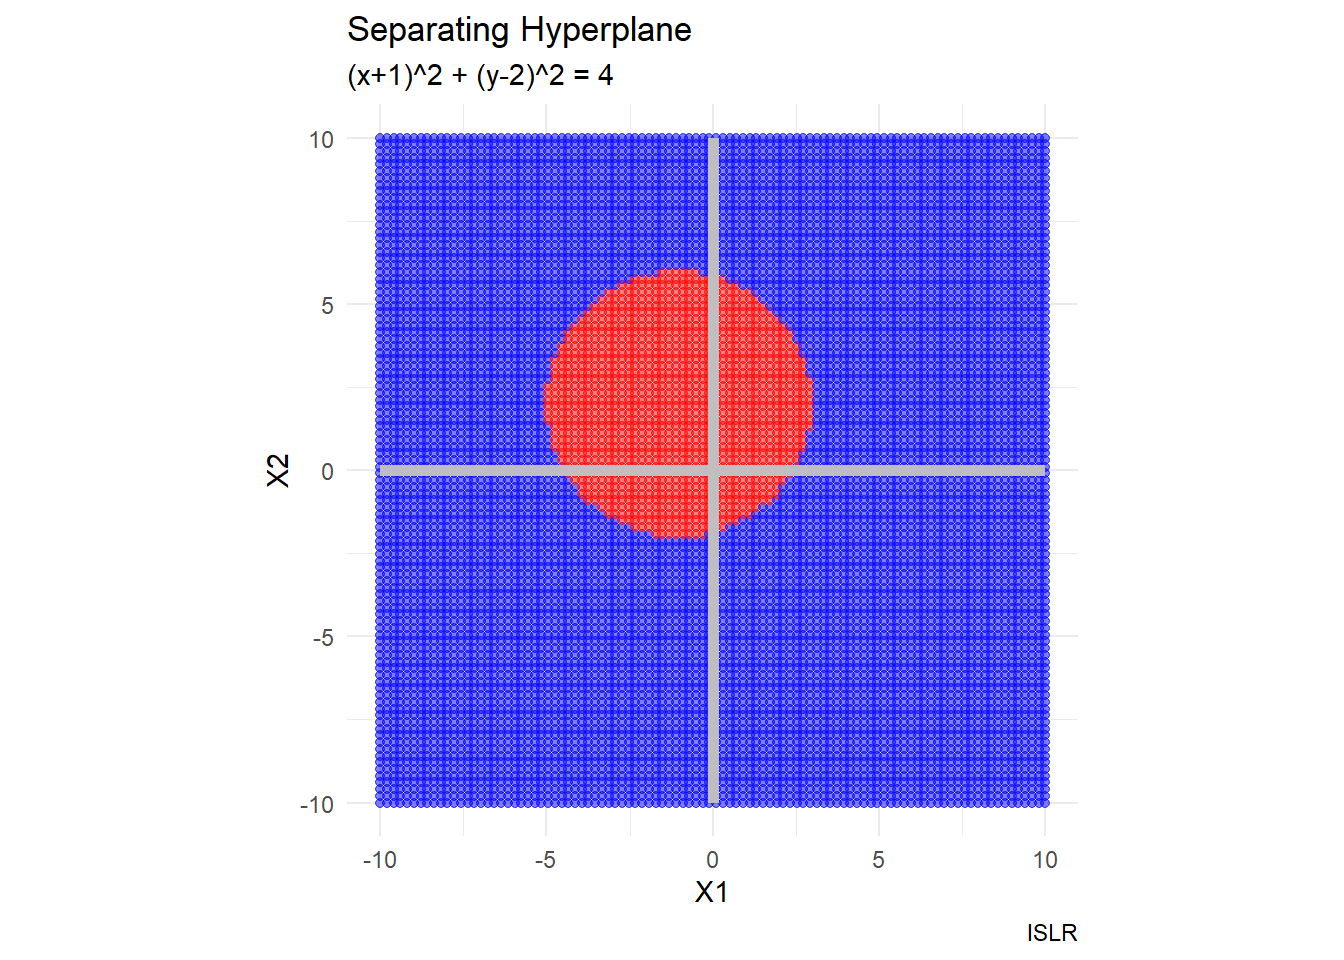
ifelse(euclidean_distance(0, 0, -1, 2) > 4, "blue", "red")[1] "red"ifelse(euclidean_distance(-1, 1, -1, 2) > 4, "blue", "red")[1] "red"ifelse(euclidean_distance(2, 2, -1, 2) > 4, "blue", "red")[1] "red"ifelse(euclidean_distance(3, 8, -1, 2) > 4, "blue", "red")[1] "blue"Conceptual Task 3
obs <- 1:7
xvals <- c(3,2,4,1,2,4,4)
yvals <- c(4,2,4,4,1,3,1)
class_label <- c("Red", "Red", "Red", "Red", "Blue", "Blue", "Blue")
df3 <- data.frame(obs, xvals, yvals, class_label)
df3 |>
ggplot() +
geom_point(aes(x = xvals, y = yvals, color = class_label),
size = 5) +
coord_equal() +
scale_color_identity() +
labs(title = "Where to Draw the Separating Hyperplane?",
# subtitle = "y = x - 0.5",
caption = "ISLR",
x = "X1", y = "X2") +
theme_minimal() +
xlim(0,5) + ylim(0,5)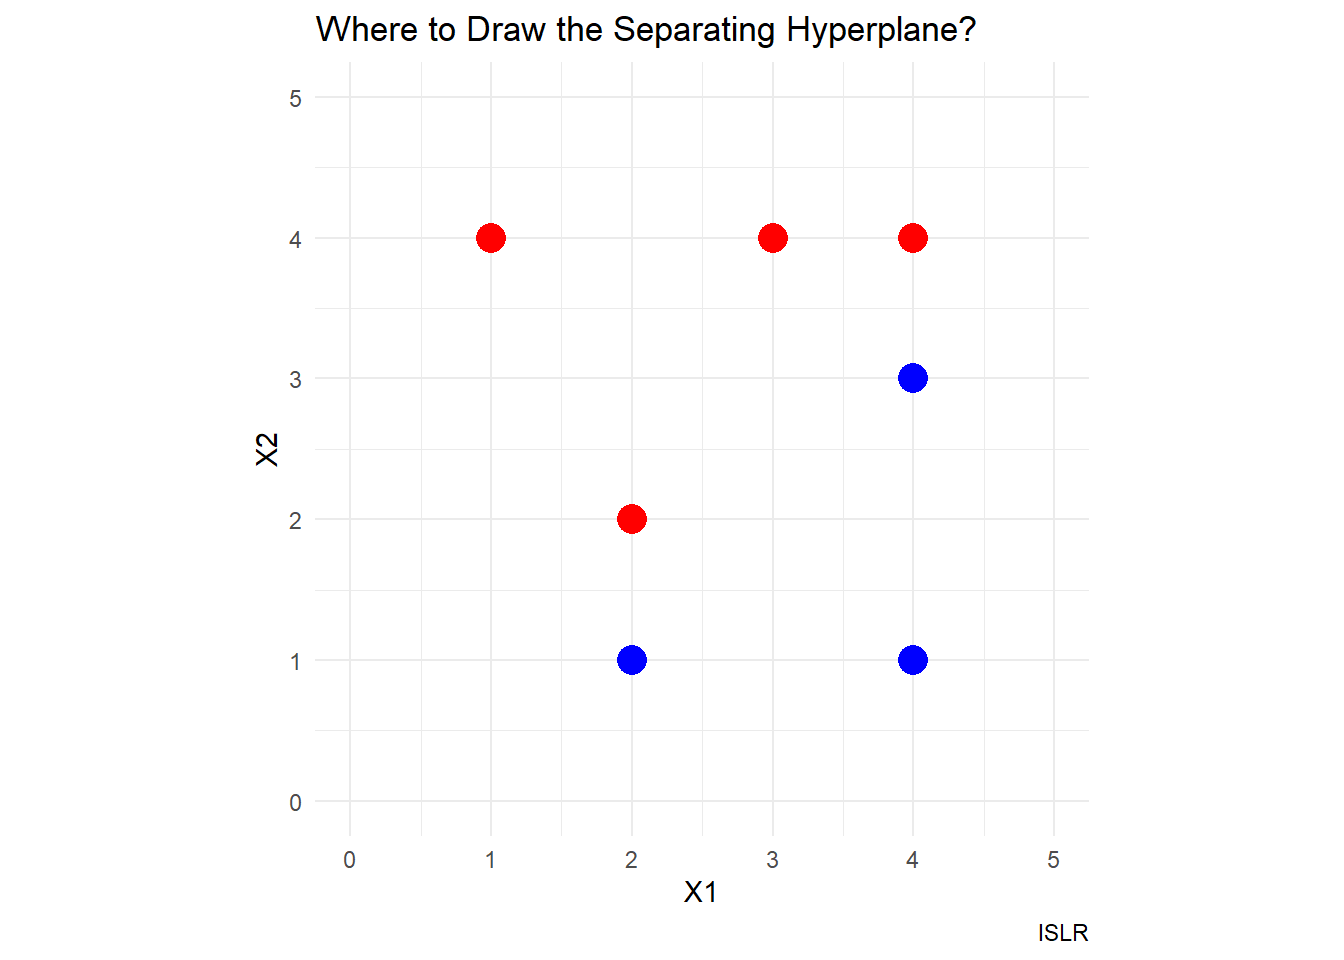
df3 |>
  ggplot() +

  # separating hyperplane
  geom_segment(aes(x = 0.5, y = 0, xend = 5, yend = 4.5),
               color = "black", linetype = 1, linewidth = 3) +

  # margins
  geom_segment(aes(x = 0, y = 0, xend = 5, yend = 5),
               color = "black", linetype = 2, linewidth = 2) +
  geom_segment(aes(x = 1, y = 0, xend = 5, yend = 4),
               color = "black", linetype = 2, linewidth = 2) +

  geom_point(aes(x = xvals, y = yvals, color = class_label),
             size = 5) +
    coord_equal() +
  scale_color_identity() +
  labs(title = "Separating Hyperplane",
       subtitle = "y = x - 0.5",
       caption = "ISLR",
       x = "X1", y = "X2") +
  theme_minimal() +
  xlim(0,5) + ylim(0,5)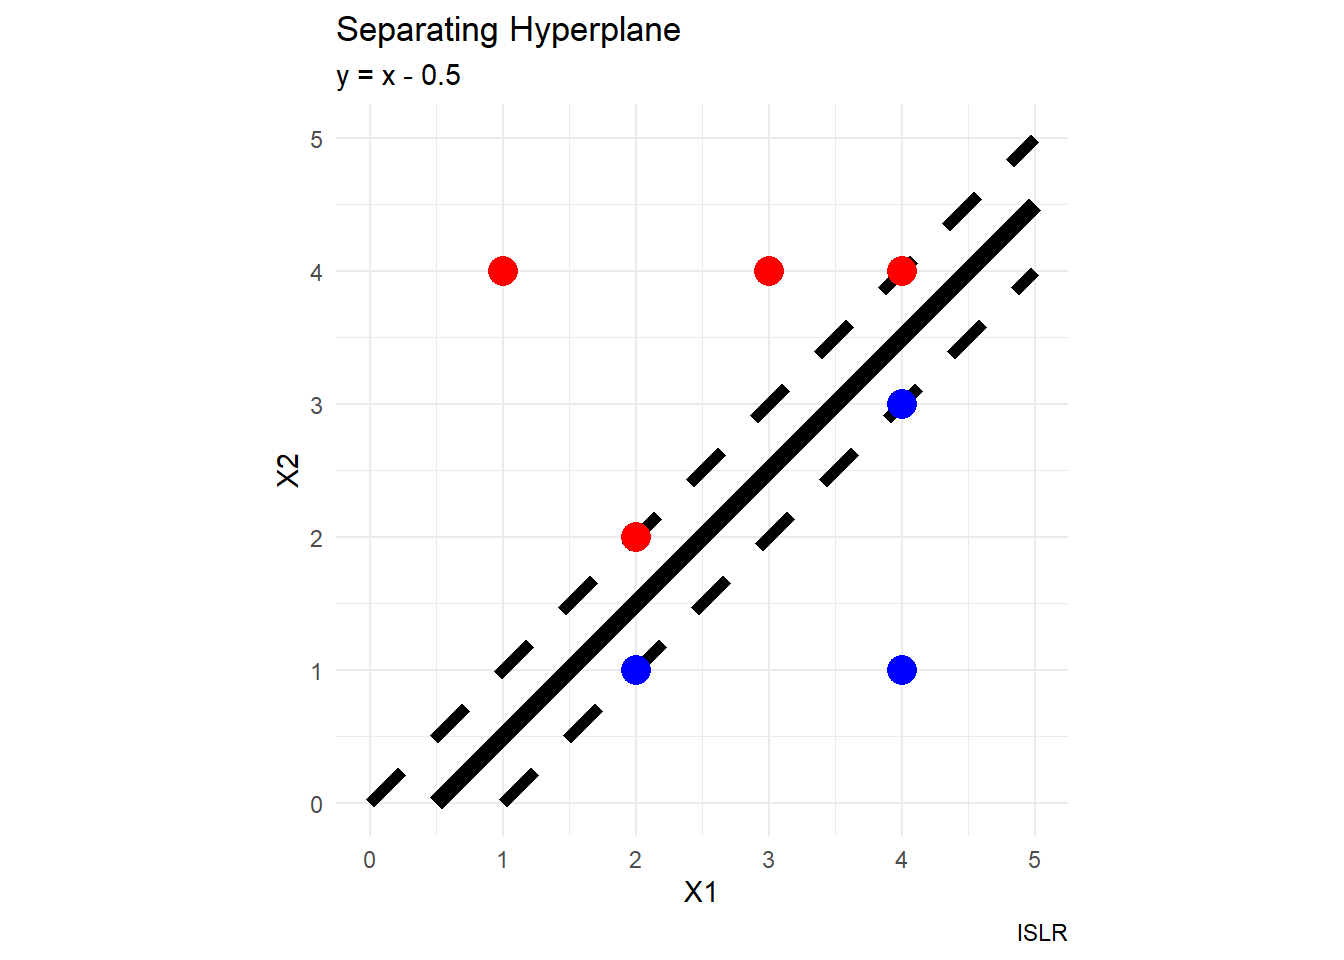
df3e <- df3 |>
  mutate(supp_vec = ifelse(obs %in% c(2,3,5,6),
                           "support vector", "other data"))

df3e$supp_vec <- factor(df3e$supp_vec,
                        levels = c("support vector", "other data"))

df3e |>
  ggplot() +

  # separating hyperplane
  geom_segment(aes(x = 0.5, y = 0, xend = 5, yend = 4.5),
               color = "black", linetype = 1, linewidth = 3) +

  # margins
  geom_segment(aes(x = 0, y = 0, xend = 5, yend = 5),
               color = "black", linetype = 2, linewidth = 2) +
  geom_segment(aes(x = 1, y = 0, xend = 5, yend = 4),
               color = "black", linetype = 2, linewidth = 2) +

  geom_point(aes(x = xvals, y = yvals, color = supp_vec),
             size = 5) +
    coord_equal() +
  scale_color_manual(values = c("purple", "gray50")) +
  labs(title = "Separating Hyperplane",
       subtitle = "y = x - 0.5",
       caption = "ISLR",
       x = "X1", y = "X2") +
  theme_minimal() +
  xlim(0,5) + ylim(0,5)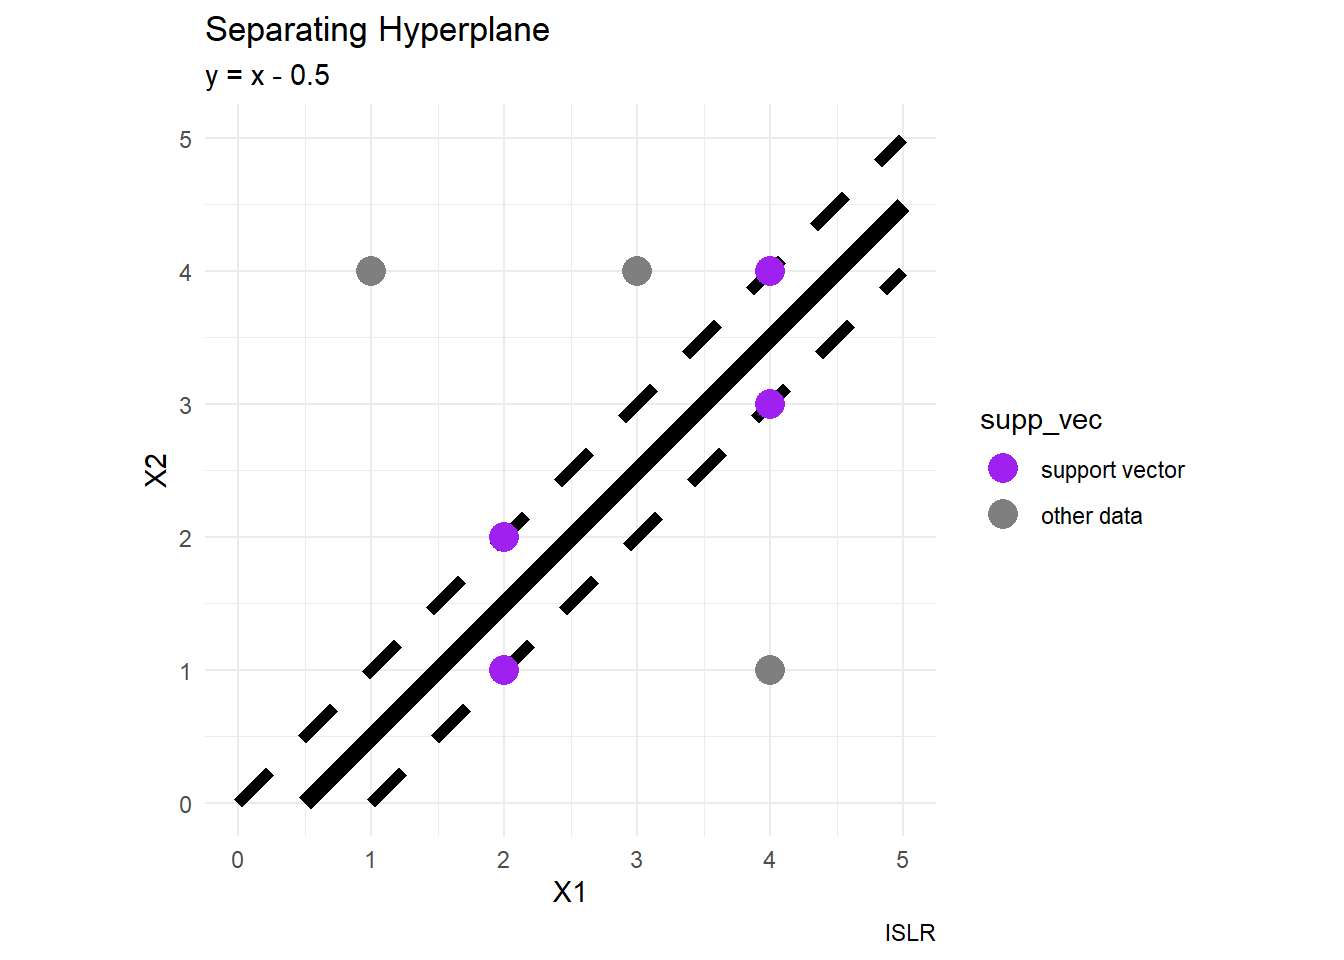
df3 |>
  ggplot() +

  # separating hyperplane
  geom_segment(aes(x = 0, y = 1/4, xend = 5, yend = 16/4),
               color = "black", linetype = 1, linewidth = 3) +

  geom_point(aes(x = xvals, y = yvals, color = class_label),
             size = 5) +
    coord_equal() +
  scale_color_identity() +
  labs(title = "Separating Hyperplane (not optimal)",
       subtitle = "y = 0.25(3x+1)",
       caption = "ISLR",
       x = "X1", y = "X2") +
  theme_minimal() +
  xlim(0,5) + ylim(0,5)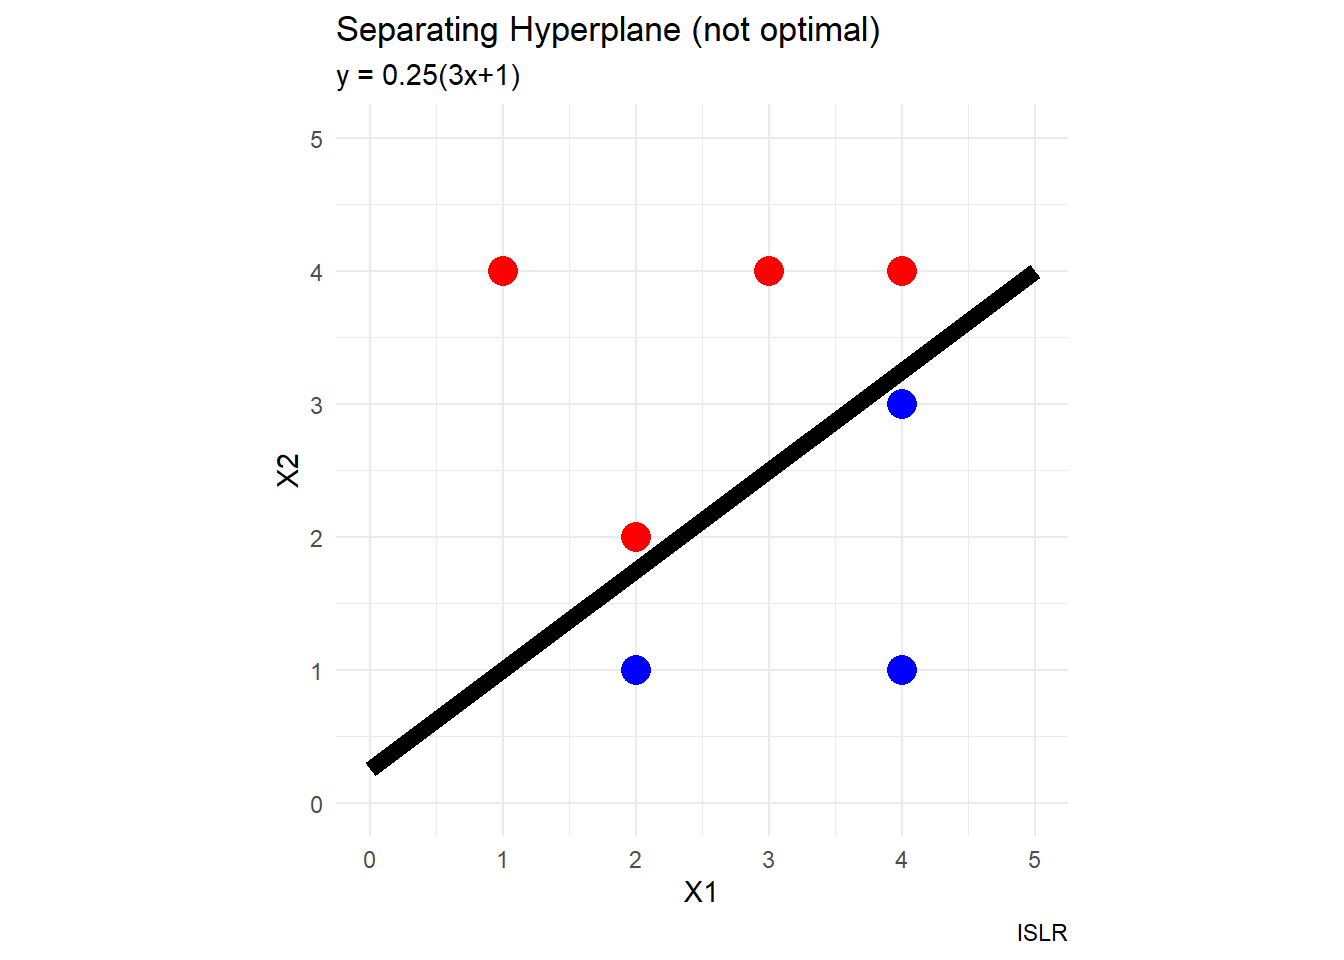
new_dot <- data.frame(obs = 8, xvals = 0, yvals = 5, class_label = "blue")
df3h <- rbind(df3, new_dot)
df3h |>
  ggplot() +
  geom_point(aes(x = xvals, y = yvals, color = class_label),
             size = 5) +
  coord_equal() +
  scale_color_identity() +
  labs(title = "Where to Draw the Separating Hyperplane?",
       subtitle = "new data at (0,5)",
       caption = "ISLR",
       x = "X1", y = "X2") +
  theme_minimal() +
  xlim(0,5) + ylim(0,5)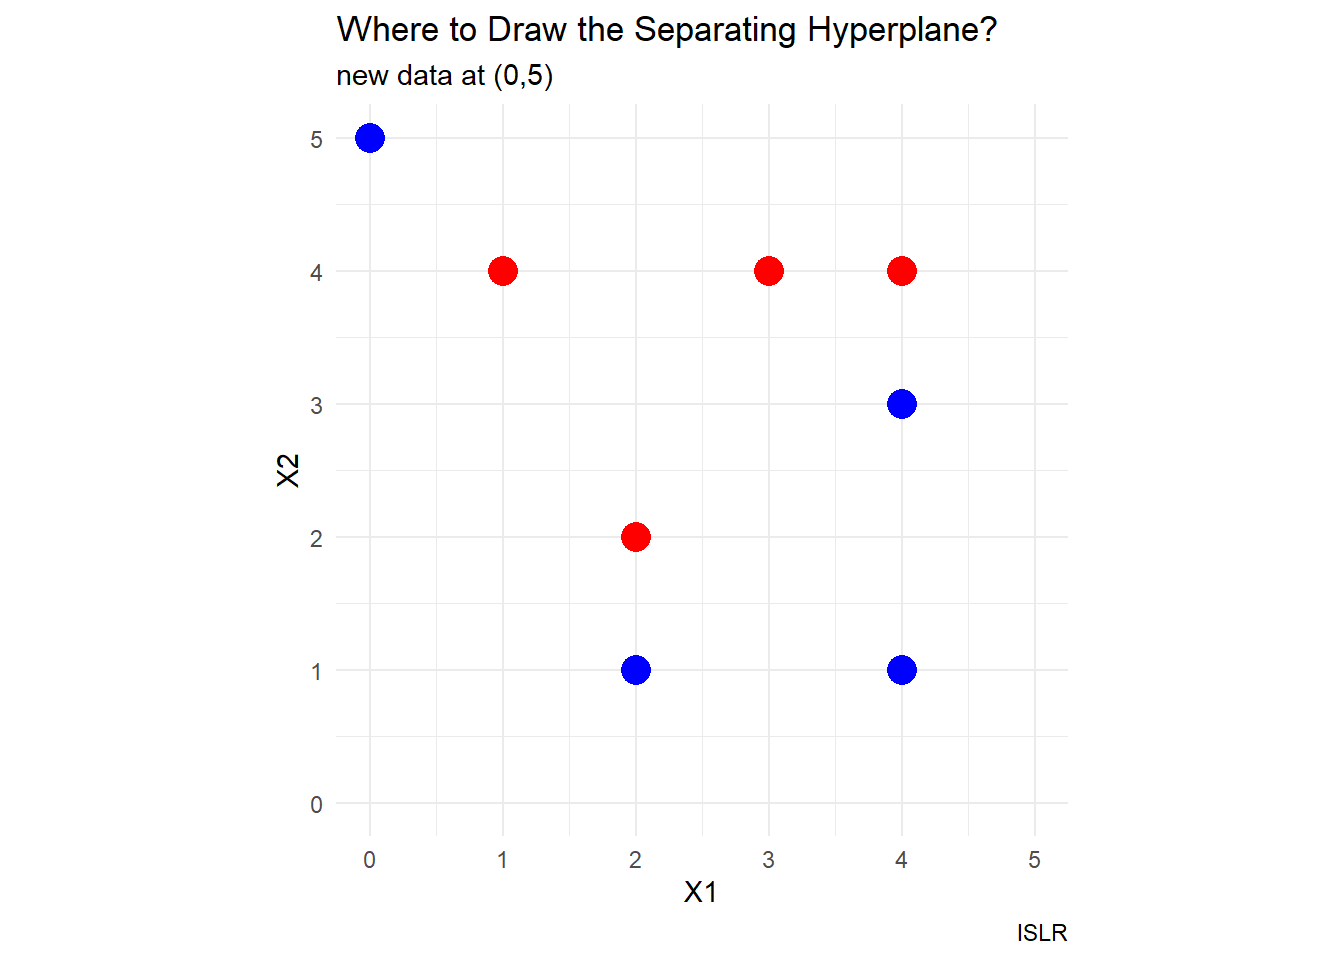
sessionInfo()R version 4.3.0 (2023-04-21 ucrt)
Platform: x86_64-w64-mingw32/x64 (64-bit)
Running under: Windows 10 x64 (build 19045)
Matrix products: default
locale:
[1] LC_COLLATE=English_United States.utf8
[2] LC_CTYPE=English_United States.utf8
[3] LC_MONETARY=English_United States.utf8
[4] LC_NUMERIC=C
[5] LC_TIME=English_United States.utf8
time zone: America/Los_Angeles
tzcode source: internal
attached base packages:
[1] stats graphics grDevices utils datasets methods base
other attached packages:
[1] ggplot2_3.4.2 dplyr_1.1.2
loaded via a namespace (and not attached):
[1] vctrs_0.6.2 cli_3.6.1 knitr_1.43 rlang_1.1.1
[5] xfun_0.39 generics_0.1.3 jsonlite_1.8.4 labeling_0.4.2
[9] glue_1.6.2 colorspace_2.1-0 htmltools_0.5.5 scales_1.2.1
[13] fansi_1.0.4 rmarkdown_2.22 grid_4.3.0 munsell_0.5.0
[17] evaluate_0.21 tibble_3.2.1 fastmap_1.1.1 yaml_2.3.7
[21] lifecycle_1.0.3 compiler_4.3.0 htmlwidgets_1.6.2 pkgconfig_2.0.3
[25] rstudioapi_0.14 farver_2.1.1 digest_0.6.31 R6_2.5.1
[29] tidyselect_1.2.0 utf8_1.2.3 pillar_1.9.0 magrittr_2.0.3
[33] withr_2.5.0 tools_4.3.0 gtable_0.3.3