library("DiagrammeR")One of my silly side-projects is to organize the dependency chart in the Settlement Survival video game into a mermaid diagram (or a similar flow chart).
I called this settlement “Palo Verde” after a town that used to exist in the Los Angeles area. I was reading about Palo Verde in a book called Stealing Home, which provides history of the area that became Dodger Stadium.
I was also reading another history book called Salt, and Settlement Survival will allow me to simulate a community that relies on salt exports.
Settings
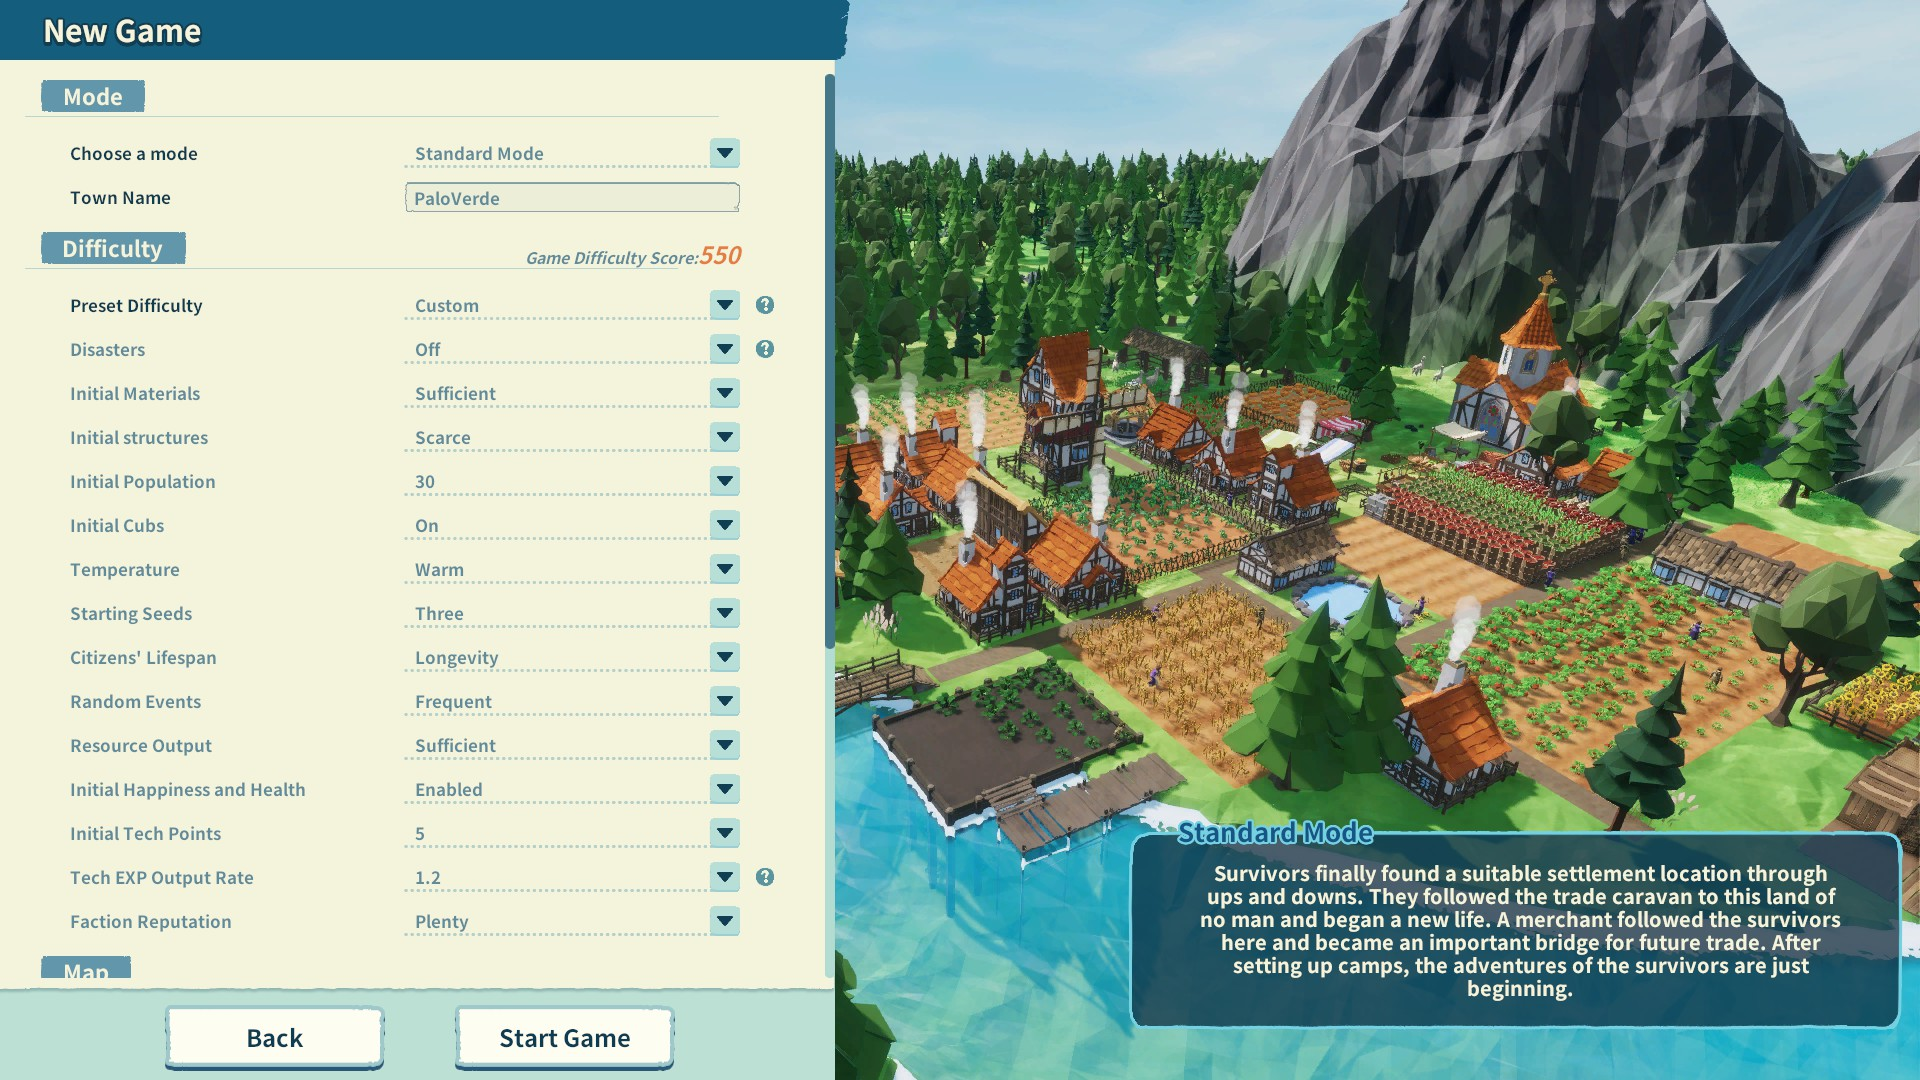
I simply play this game on “easy” difficulty settings to relax. That mainly means that natural disasters will not fall onto Palo Verde.
Settings
Year 1: Settlement
Today, I will start with the beginning of the game—that is, what tends to be built in the first “year”. I am going to take some liberties and actually add more prerequisites in the beginning (otherwise, the graph simply starts with about 9 unlinked nodes).
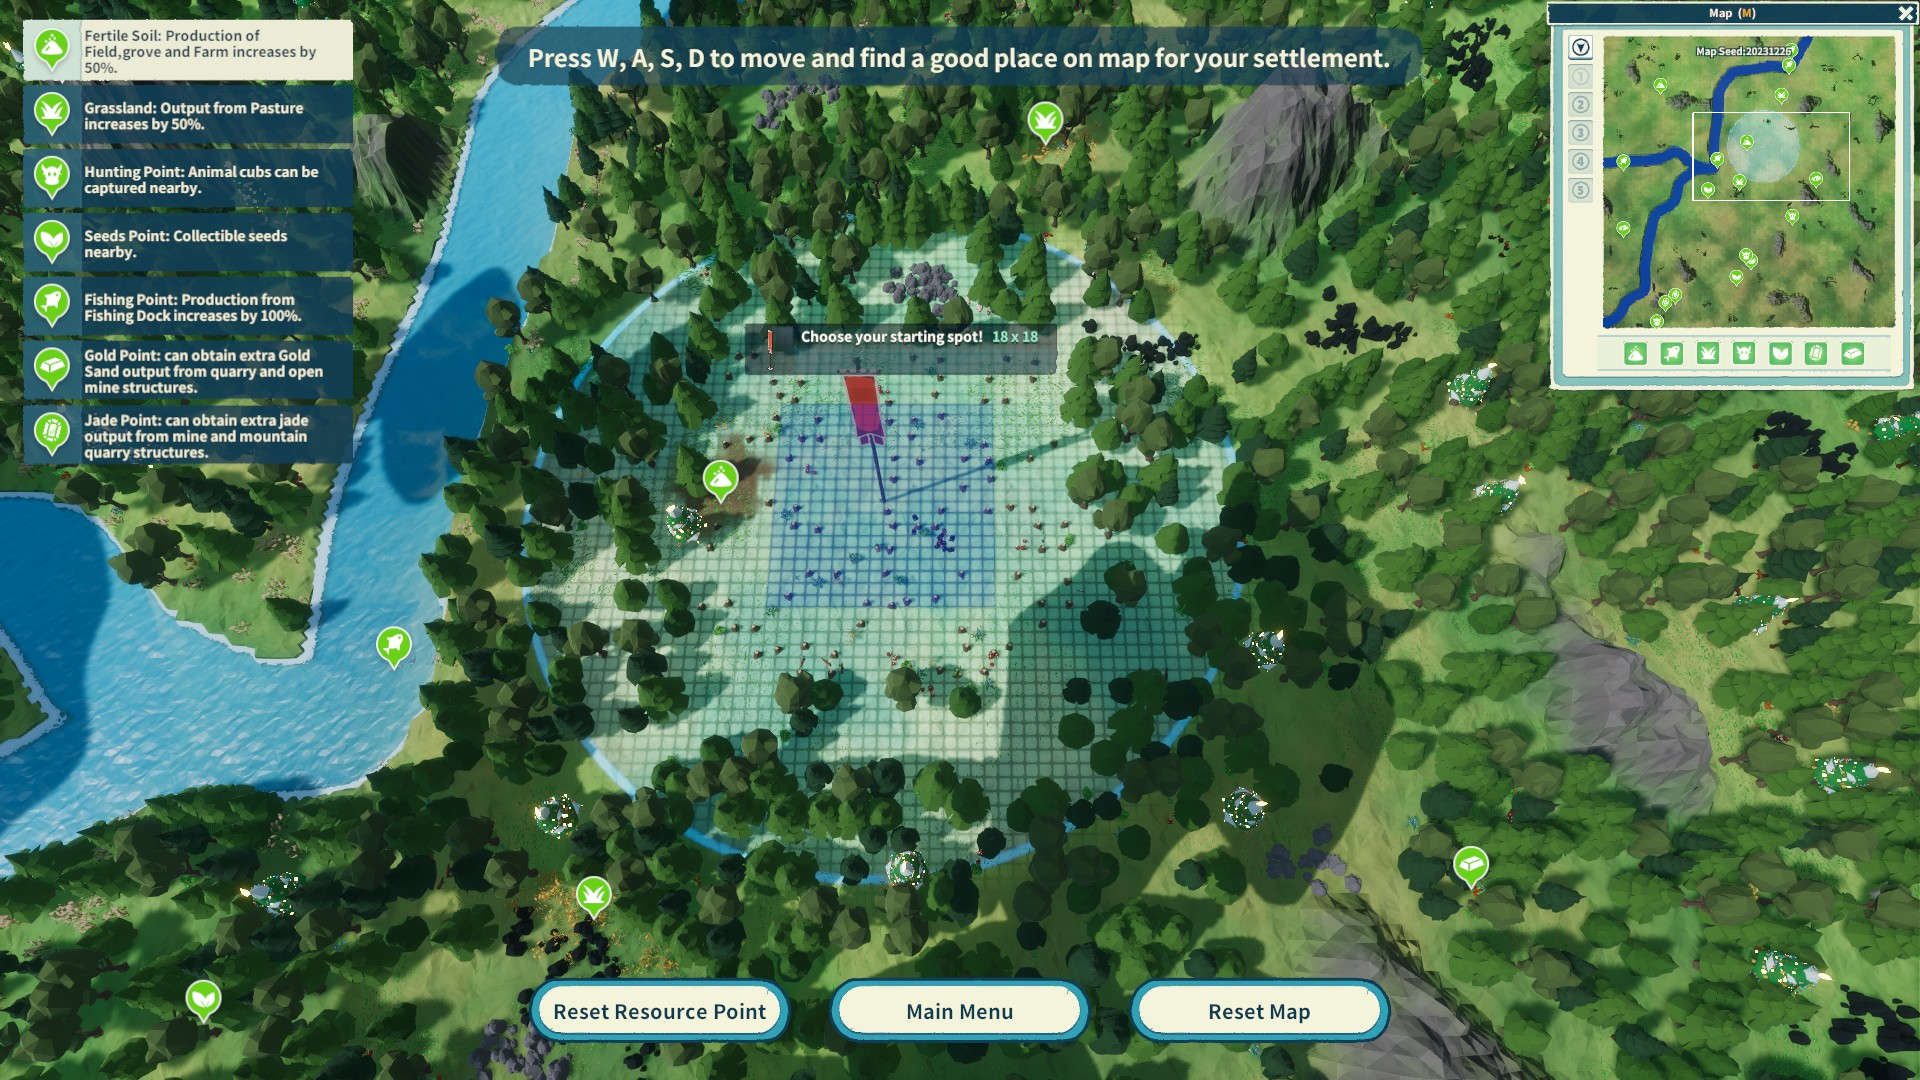
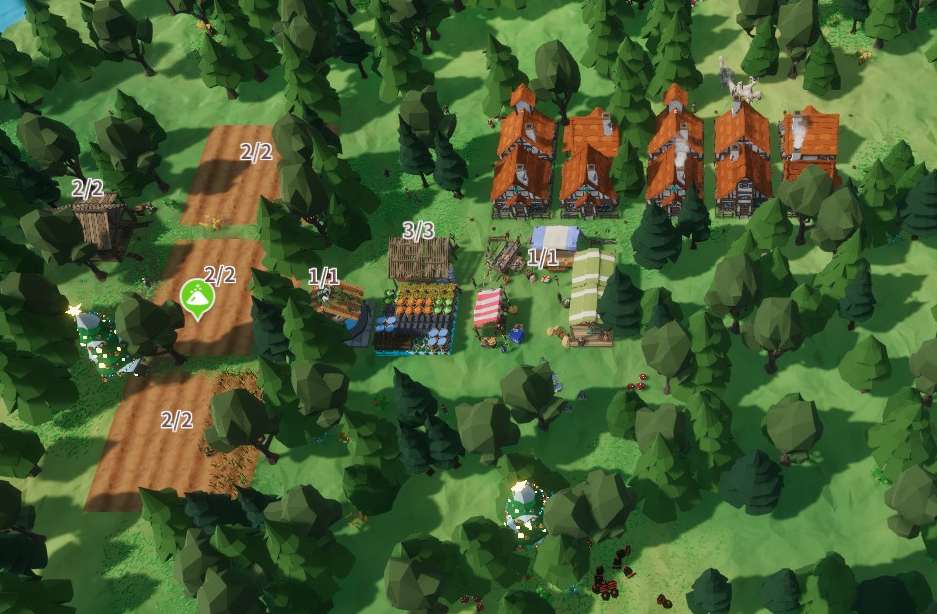
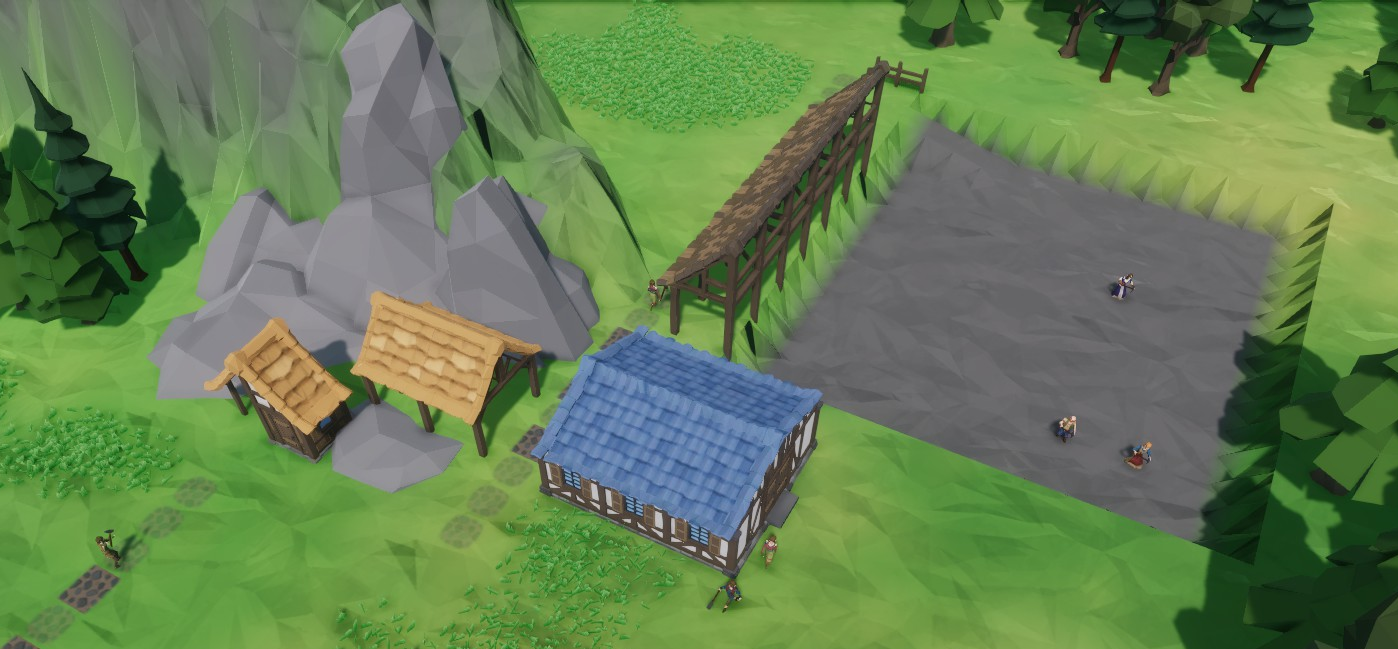
We choose a place that appeared to have promising grounds for fields and farming while still near to some mountains.
year_1_tree <- DiagrammeR::mermaid("
  graph TD
  start[Select Location]

  house1[1 House]
  fields[3 Standard Fields]
  water[Big Well]
  forest_hut[Forester's Hut]
  gather_hut[Gatherer's Hut]
  hunter_hut[Hunter's Hut]
  chopping_house[Chopping House]
  house10[10 Houses]

  start --> house1
  start --> fields
  start --> water
  start --> hunter_hut

  house1 --> house10
  fields --> forest_hut
  water --> gather_hut
  hunter_hut --> chopping_house
")

# print
year_1_tree
Houses and Farms
The initial 30 settlers want at least 7 houses to comfortably live with their families.
Meanwhile, we start with 3 standard fields to grow food
- 2 fields of cabbages
- one field of pumpkins on the especially fertile grounds
Division of Labor
After the farmers sow seeds for the year, I send some to build a Forester's Hut out in the woods to coordinate the chopping down of trees to get fuel for to survive the first winter.
Some folks quickly make a Big Well and one of them works as a water deliverer. Others move out to the forest too to build a Gatherer's Hut to gather wild herbs and berries.
Forestry
You can toggle the desire for the foresters to
- fell trees
- plant trees
For instance, by telling the forester to not chop down trees, a lush forest will grow around the Forester's Hut, which may be better for the nearby Gatherer's Hut. You can always ask the townsfolk at large to chop down trees when needed.
A hunter also went out in to the woods to build a Hunter's Hut, but the town has a higher priority to have firewood, so the crew is sent back into the main village to build a Chopping House.
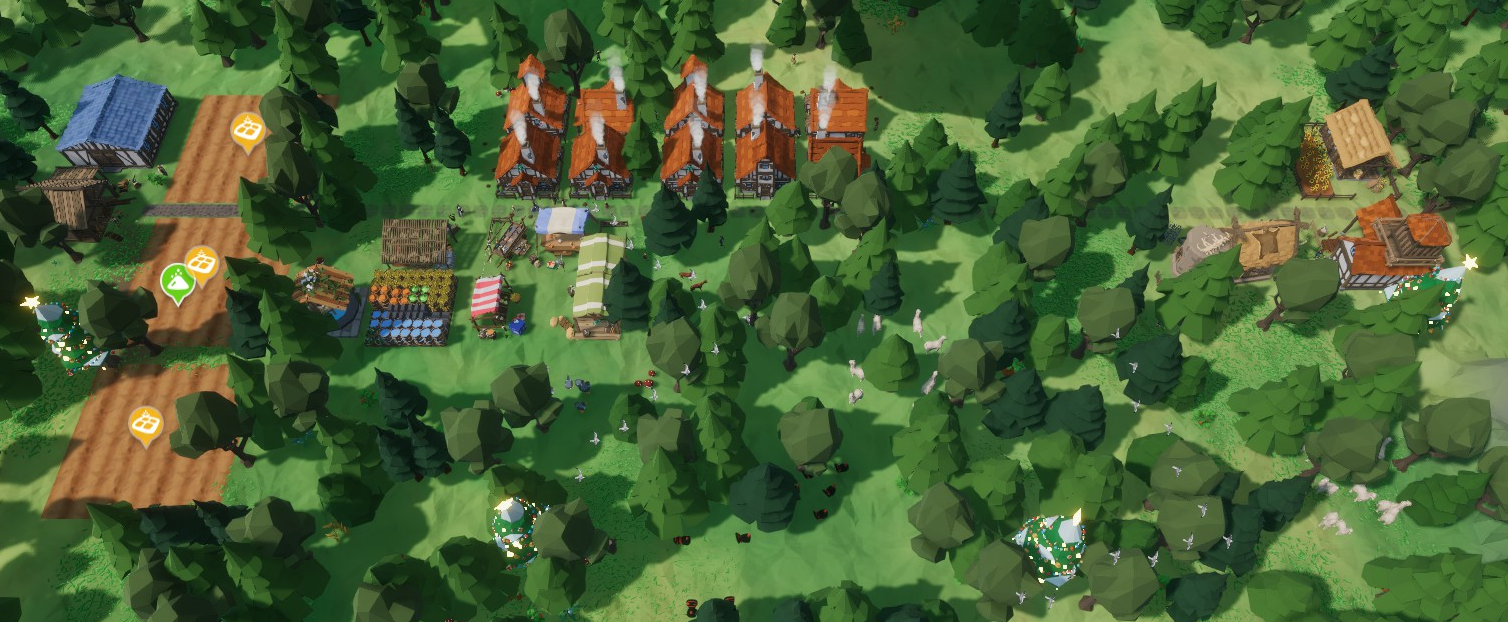
Early ambition leads to some surplus of supplies, so we spend a tech point to learn how to build a Warehouse for storage.
Year 2: Community
After surviving the first winter on the inventory that we arrived with at the marketplace, our main priorities are to grow crops for sustenance and chopping wood for survival. Nevertheless, the townsfolk want to build a community, so let us build
- a
Chapel(for the game mechanic of happiness) - a
Clinic(for the game mechanic of health) - a
School(game mechanic where educated people are more productive at their jobs) - 2
Latrine(a lot of city planning is “Where does the poop go?”)
year_2_tree <- DiagrammeR::mermaid("
  graph TD
  start[Select Location]

  house1[1 House]
  fields[3 Standard Fields]
  water[Big Well]
  forest_hut[Forester's Hut]
  gather_hut[Gatherer's Hut]
  hunter_hut[Hunter's Hut]
  chopping_house[Chopping House]
  house10[10 Houses]
  chapel[Chapel]
  clinic[Clinic]
  school[School]
  latrine[2 Latrines]

  start --> house1
  start --> fields
  start --> water
  start --> hunter_hut

  house1 --> house10
  fields --> forest_hut
  water --> gather_hut
  hunter_hut --> chopping_house

  house10 --> chapel
  forest_hut --> clinic
  gather_hut --> school
  chopping_house --> latrine
")

# print
year_2_tree
Year 3: Immigration
The original settlers are a little homesick and want some more of the variety that their former towns had. Alas, we don’t have many people leftover to take on new jobs, so we need to welcome immigrants to our settlement. This means demand for new homes to house them all and a Town Hall for these official matters.
year_3_tree <- DiagrammeR::mermaid("
graph TD
start[Select Location]
house1[1 House]
fields[3 Standard Fields]
water[Big Well]
forest_hut[Forester's Hut]
gather_hut[Gatherer's Hut]
hunter_hut[Hunter's Hut]
chopping_house[Chopping House]
house10[10 Houses]
chapel[Chapel]
clinic[Clinic]
school[School]
latrine[2 Latrines]
town_hall[Town Hall]
start --> house1
start --> fields
start --> water
start --> hunter_hut
house1 --> house10
fields --> forest_hut
water --> gather_hut
hunter_hut --> chopping_house
house10 --> chapel
forest_hut --> clinic
gather_hut --> school
chopping_house --> latrine
chapel --> town_hall
clinic --> town_hall
school --> town_hall
latrine --> town_hall
")
# print
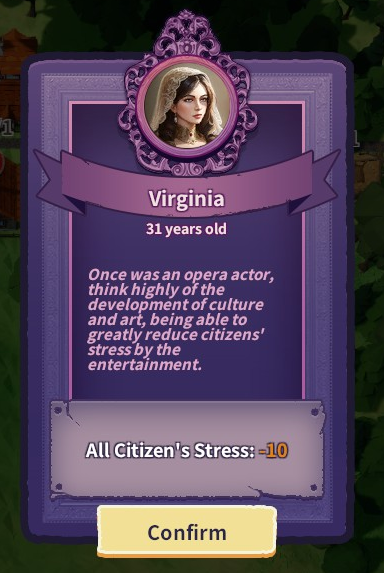
year_3_treeUpon reaching a population of 50, we elected an administrator to start to oversee matters. The charismatic Virginia uses her experience in entertainment to reduce the stress of the citizens.
The other candidate was personable too, but ran on a platform of increased fruit yield (but we don’t have any orchards yet).
Year 4: Mining
In this magical land, the trees grow back quickly, so having enough lumber is easy to achieve. However, stone and iron ore do not replenish in the grassy valleys, so we ask the young laborers to excavate
- a
Minein a mountainside - a
Quarryalong the border of our territory
Both are indestructible (cannot reclaim the land nor materials), so we placed both features far from the main community areas.
year_4_tree <- DiagrammeR::mermaid("
  graph TD
  town_hall[Town Hall]
  mine[Mine]
  quarry[Quarry]

  town_hall --> mine
  town_hall --> quarry
")

# print
year_4_tree
Year 5: Dredge
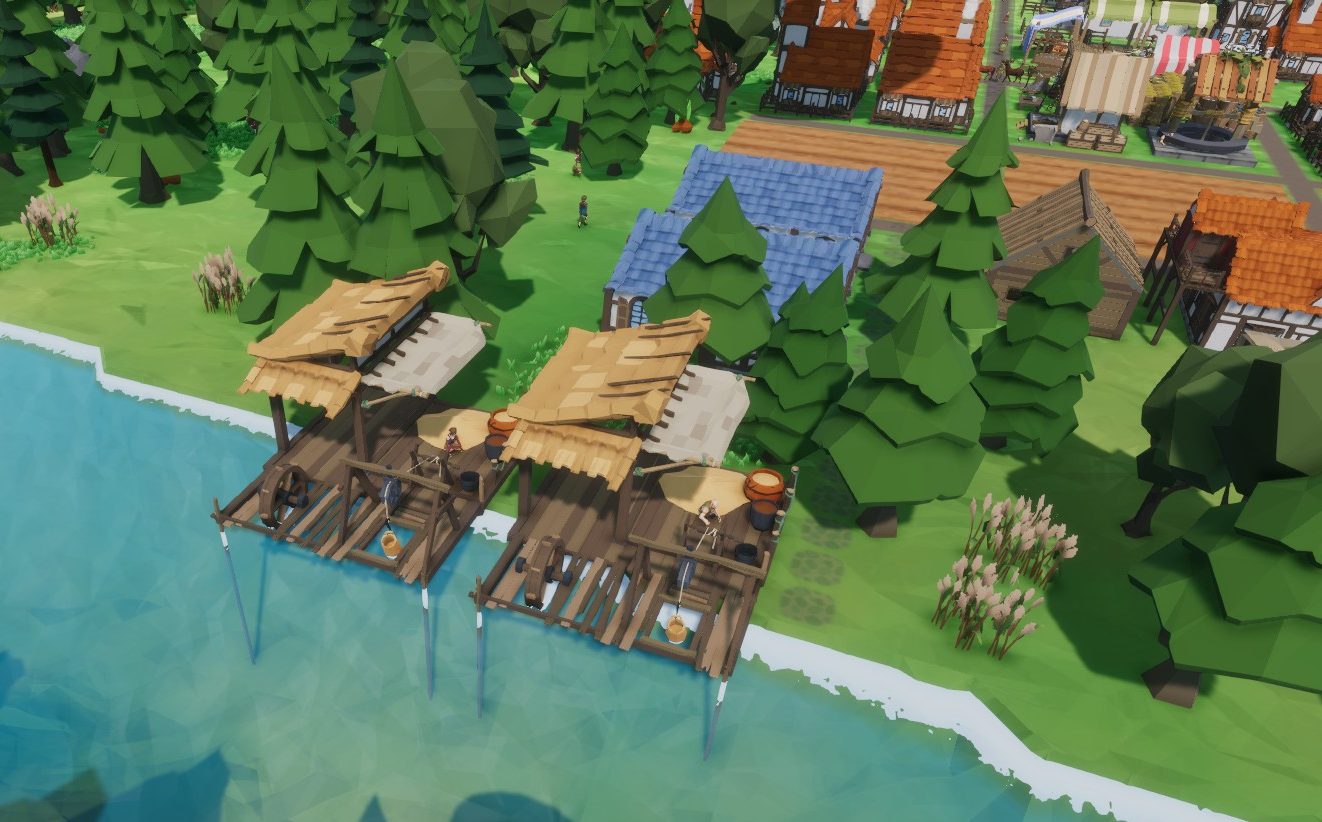
With a steady supply of stone and iron ore (for now), we can look toward the river for more resources. The clever townsfolk construct 2 Sandpit—one to gather sand, and another to gather clay. The sand pits are placed near the warehouses for quick storage.
Meanwhile, work out in the Mine, in the Quarry, and on the fields creates wear and tear. The townsfolk needed rough clothes and stone tools. Thus, a Tailor and a Smithy are granted buildings to meet those respective needs.
year_5_tree <- DiagrammeR::mermaid("
  graph TD
  town_hall[Town Hall]
  mine[Mine]
  quarry[Quarry]
  sandpit_sand[Sand Pit: Sand]
  sandpit_clay[Sand Pit: Clay]
  tailor[Tailor]
  smithy[Smithy]

  town_hall --> mine
  town_hall --> quarry

  mine --> sandpit_sand
  quarry --> sandpit_sand
  mine --> sandpit_clay
  quarry --> sandpit_clay
  town_hall --> tailor
  quarry --> smithy
")

# print
year_5_tree
Year 6: Animals
A fad grabbed the attention of entreprenuerial townsfolk, and they built a couple of Apiary to raise bees. We can either gather honey or beeswax at apiaries, and we focus on the latter now by storing surplus beeswax in the warehouses.
Commentary on Apiaries
I liked the apiaries in-game because the trade value of beeswax. However, patches of the game nerfed some abilities to accelerate the growth of settlements (while enhancing other aspects of the game). Now, the beeswax is no more valuable than selling crops from the fields. I chose to build 2 apiaries here (along with assigning 3 villagers to each) out of nostalgia. Furthermore, I liked having a crop (beeswax) that was separate from our main food supplies.
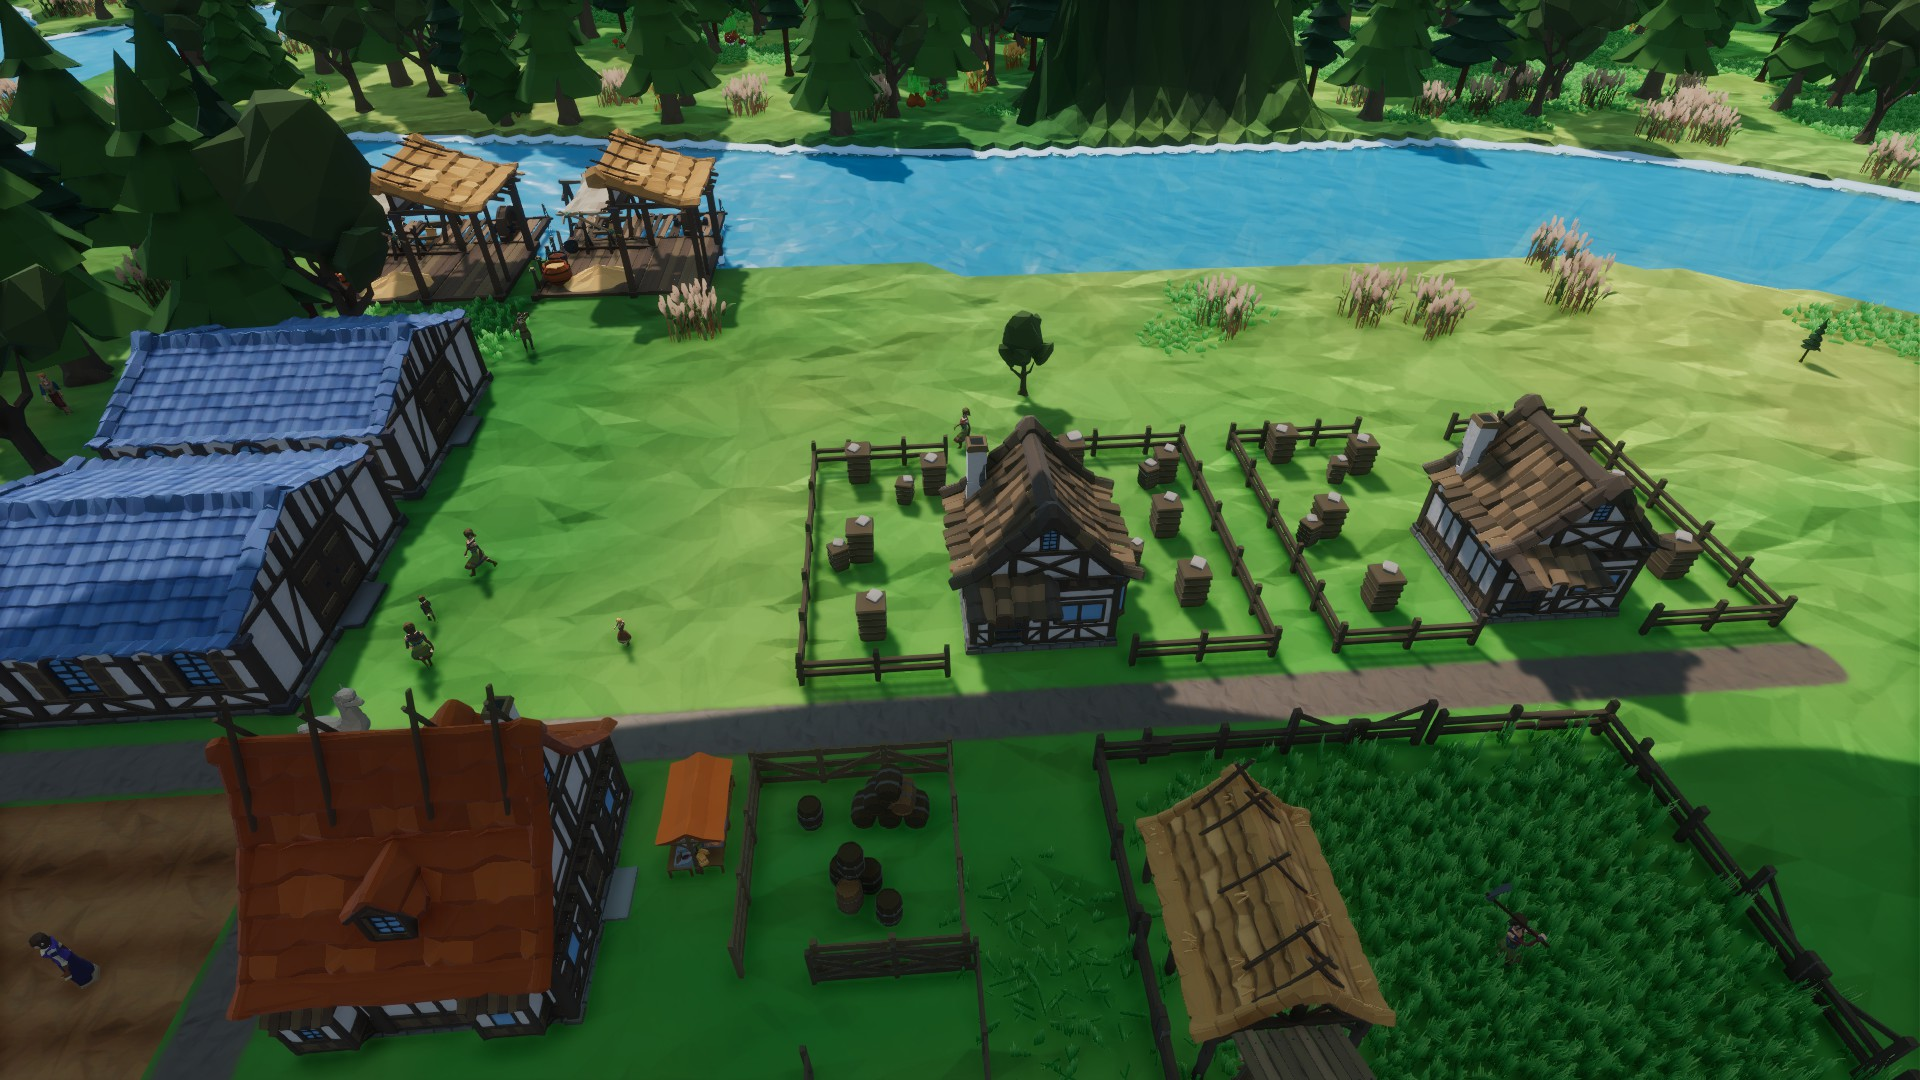
Also, with the growing town, finding animals through the Hunters Hut did not produce enough materials for the Tailor, so we dedicated some land as a Pasture to raise some alpacas to eventually get a steady supply of fur, fat, and meat.
year_6_tree <- DiagrammeR::mermaid("
  graph TD
  town_hall[Town Hall]
  mine[Mine]
  quarry[Quarry]
  sandpit_sand[Sand Pit: Sand]
  sandpit_clay[Sand Pit: Clay]
  tailor[Tailor]
  smithy[Smithy]
  apiary[Apriary]
  pasture[Pasture]

  town_hall --> mine
  town_hall --> quarry

  mine --> sandpit_sand
  quarry --> sandpit_sand
  mine --> sandpit_clay
  quarry --> sandpit_clay
  town_hall --> tailor
  quarry --> smithy

  sandpit_sand --> apiary
  sandpit_clay --> apiary
  tailor --> pasture
")

# print
year_6_tree
Year 7: Trade
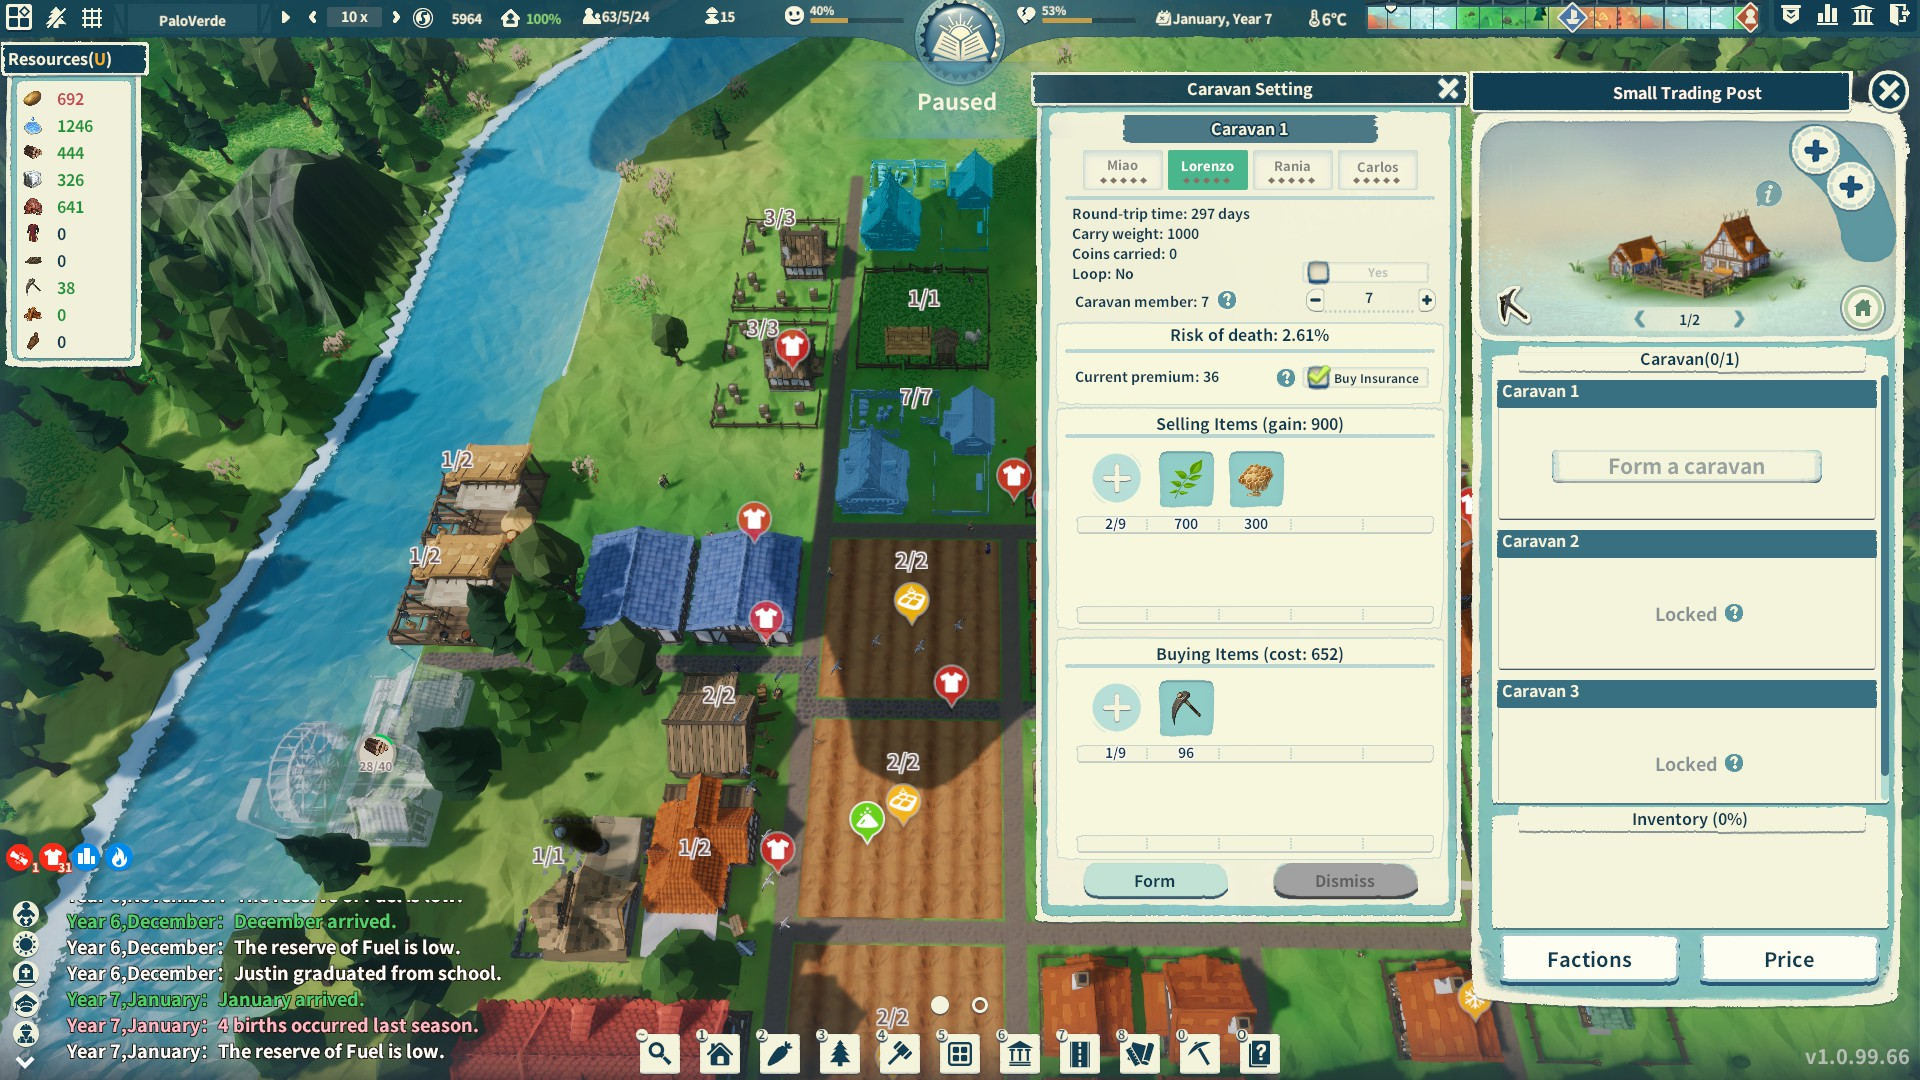
While the tailor and smithy are valued members of the community, it seems that production of clothes and tools respectively will not match the needs for a growing settlement. We build a Small Trading Post and send out caravans (7 villagers each) to buy those supplies. We have plenty of flax (from the initial settlement supplies) and beeswax (from the apiaries) to sell in the processes. I try to obtain each desired good at an amount of double the current population, but also mindful to try to make the caravan have a positive gain in silver coins.
Commentary on Insurance
Yes, it seems to be good to always get the insurance (small cost now, but pays out if the caravan trip does not return). The game has been refined to make the insurance worth it.
year_7_tree <- DiagrammeR::mermaid("
  graph TD
  town_hall[Town Hall]
  mine[Mine]
  quarry[Quarry]
  sandpit_sand[Sand Pit: Sand]
  sandpit_clay[Sand Pit: Clay]
  tailor[Tailor]
  smithy[Smithy]
  apiary[Apriary]
  pasture[Pasture]
  small_trading_post[Small Trading Post]

  town_hall --> mine
  town_hall --> quarry

  mine --> sandpit_sand
  quarry --> sandpit_sand
  mine --> sandpit_clay
  quarry --> sandpit_clay
  town_hall --> tailor
  quarry --> smithy

  sandpit_sand --> apiary
  sandpit_clay --> apiary
  tailor --> pasture

  apiary --> small_trading_post
")

# print
year_7_tree
The first trade sent beeswax and flax to Miao’s faction in exchange for rough clothes.
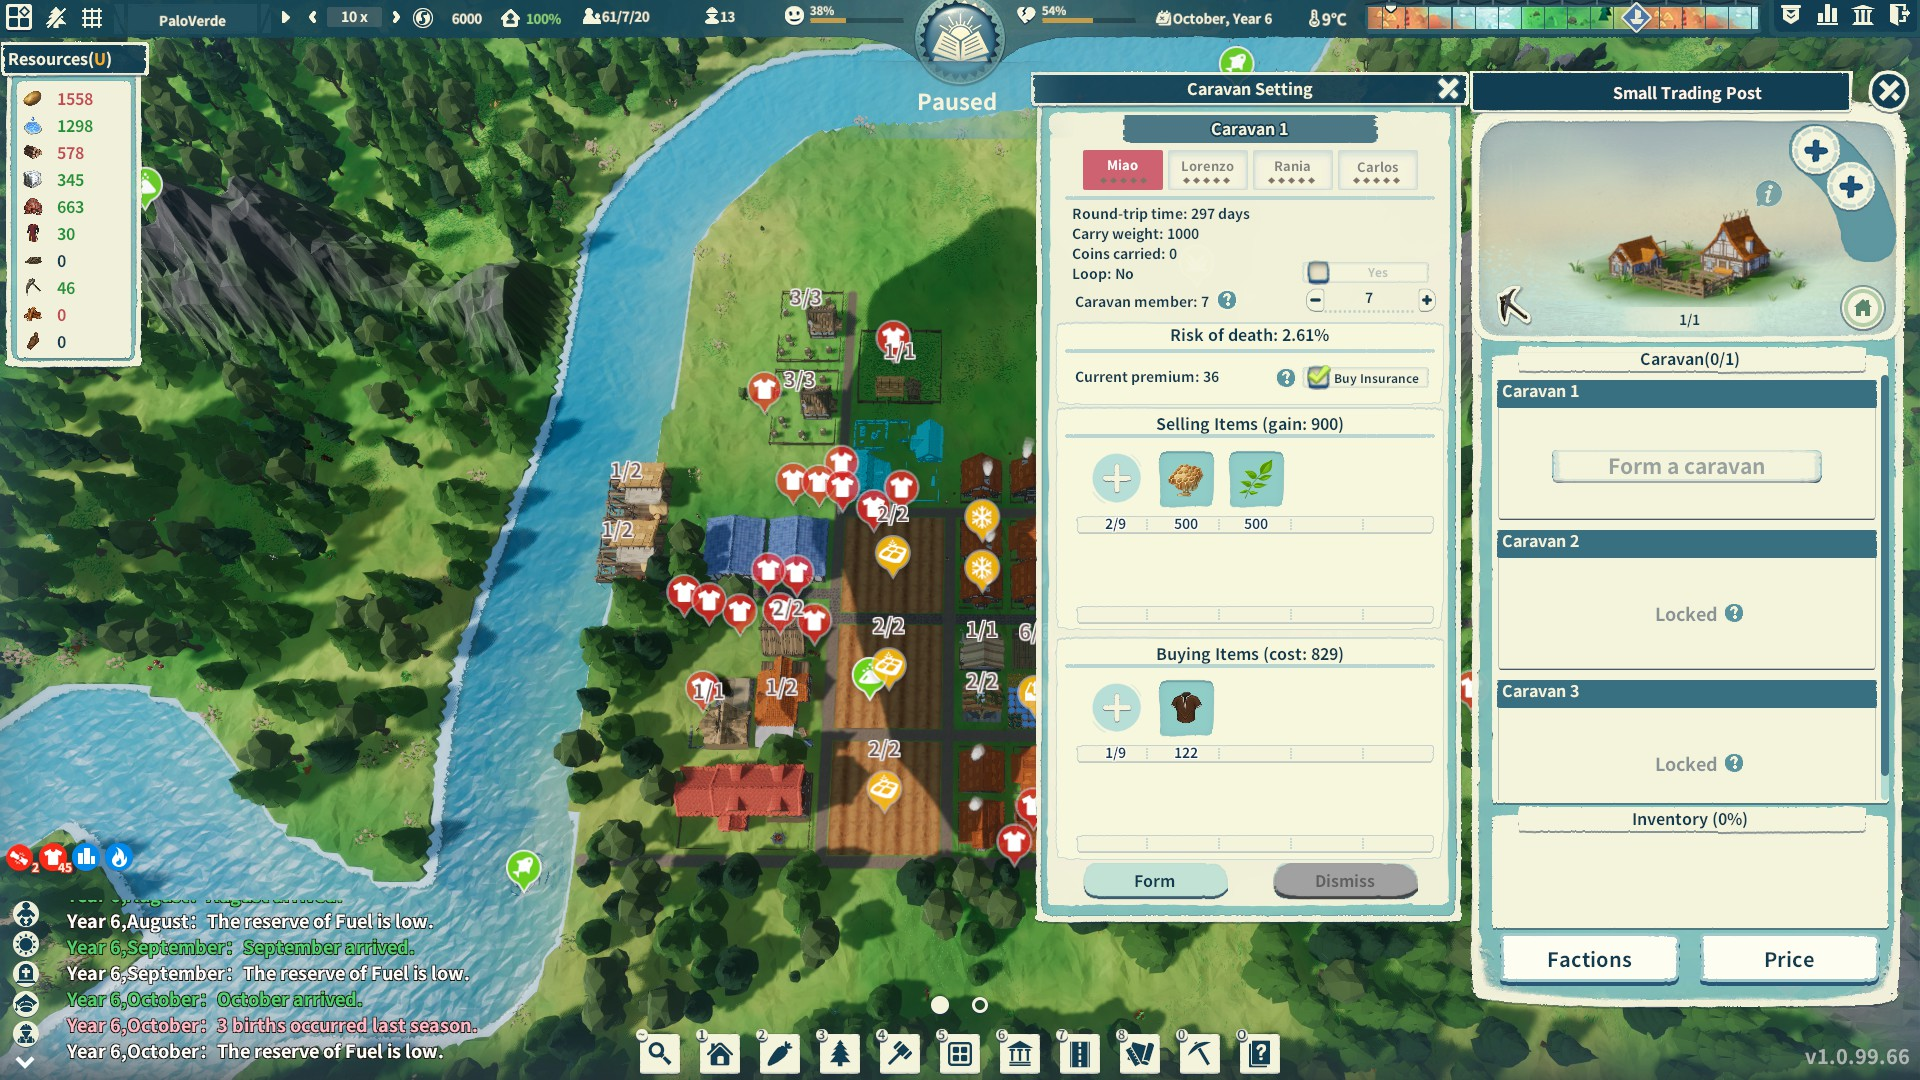
The first trade sent beeswax and flax to Lorenzo’s faction in exchange for iron tools.