# Bioconductor
library("airway")
library("ComplexHeatmap")
library("DESeq2")
library("org.Hs.eg.db")
library("SummarizedExperiment")
data(airway)

# data visualization
library("circlize")
library("ggplot2")
library("ggtext")

# data wrangling
library("dplyr")
library("magrittr")
library("tidyr")
Data Set
The airway package in the Bioconductor suite is maintained by Michael Love, and it contains data from the experiment results published by Himes, et al in 2014. “that summarizes an RNA-seq experiment wherein airway smooth muscle cells were treated with dexamethasone, a synthetic glucocorticoid steroid with anti-inflammatory effects”.

In the RangedSummarizedExperiment object, we can use the rowData command from SummarizedExperiment to look at meta data that has been collected about the reads. Here, I then present only the column names of that rowData for brevity.
 [1] "gene_id"          "gene_name"        "entrezid"         "gene_biotype"
 [5] "gene_seq_start"   "gene_seq_end"     "seq_name"         "seq_strand"
 [9] "seq_coord_system" "symbol"           "exonic_length"
In the RangedSummarizedExperiment object, we can use the rowData command from SummarizedExperiment to look at meta data that has been collected about the samples. Here, I then present only a subset of that colData for brevity.
DataFrame with 6 rows and 6 columns
           SampleName     cell      dex    albut        Run avgLength
             <factor> <factor> <factor> <factor>   <factor> <integer>
SRR1039508 GSM1275862  N61311     untrt    untrt SRR1039508       126
SRR1039509 GSM1275863  N61311     trt      untrt SRR1039509       126
SRR1039512 GSM1275866  N052611    untrt    untrt SRR1039512       126
SRR1039513 GSM1275867  N052611    trt      untrt SRR1039513        87
SRR1039516 GSM1275870  N080611    untrt    untrt SRR1039516       120
SRR1039517 GSM1275871  N080611    trt      untrt SRR1039517       126
Toward Gene Expression
Overall, I want to focus on the genes and the assay of counts of gene expression. Continuing with the EnhancedVolcano documentation, we “annotate the Ensembl gene IDs to gene symbols”.
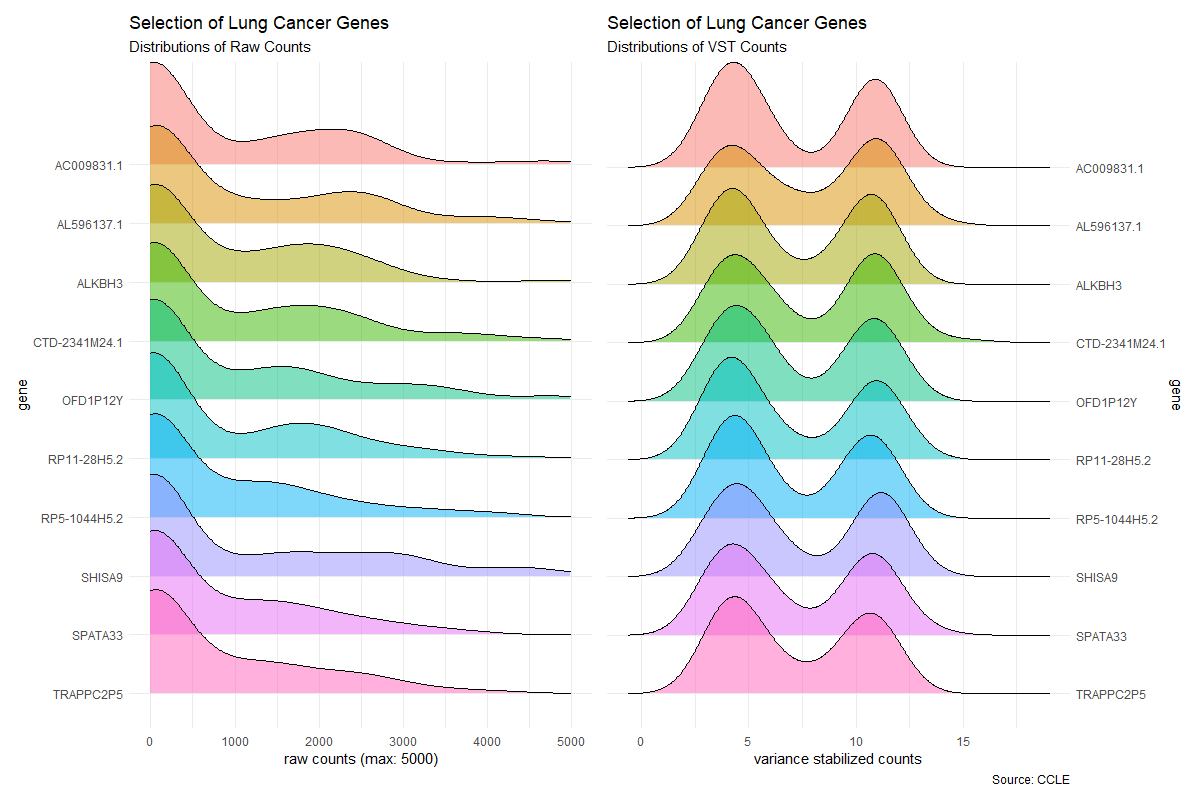
Variance Stabilizing Transformation
To the best of my novice knowledge, lab technicians can obtain reads of the RNA-Seq at various levels of quality and “better” reads can come from multiple scans. However, when seeking counts of gene expression, some genes now have much more representation than others simply from the scanning processes. We perform variance stabilizing transformation to normalize the data to treat the sequence data more similarly.
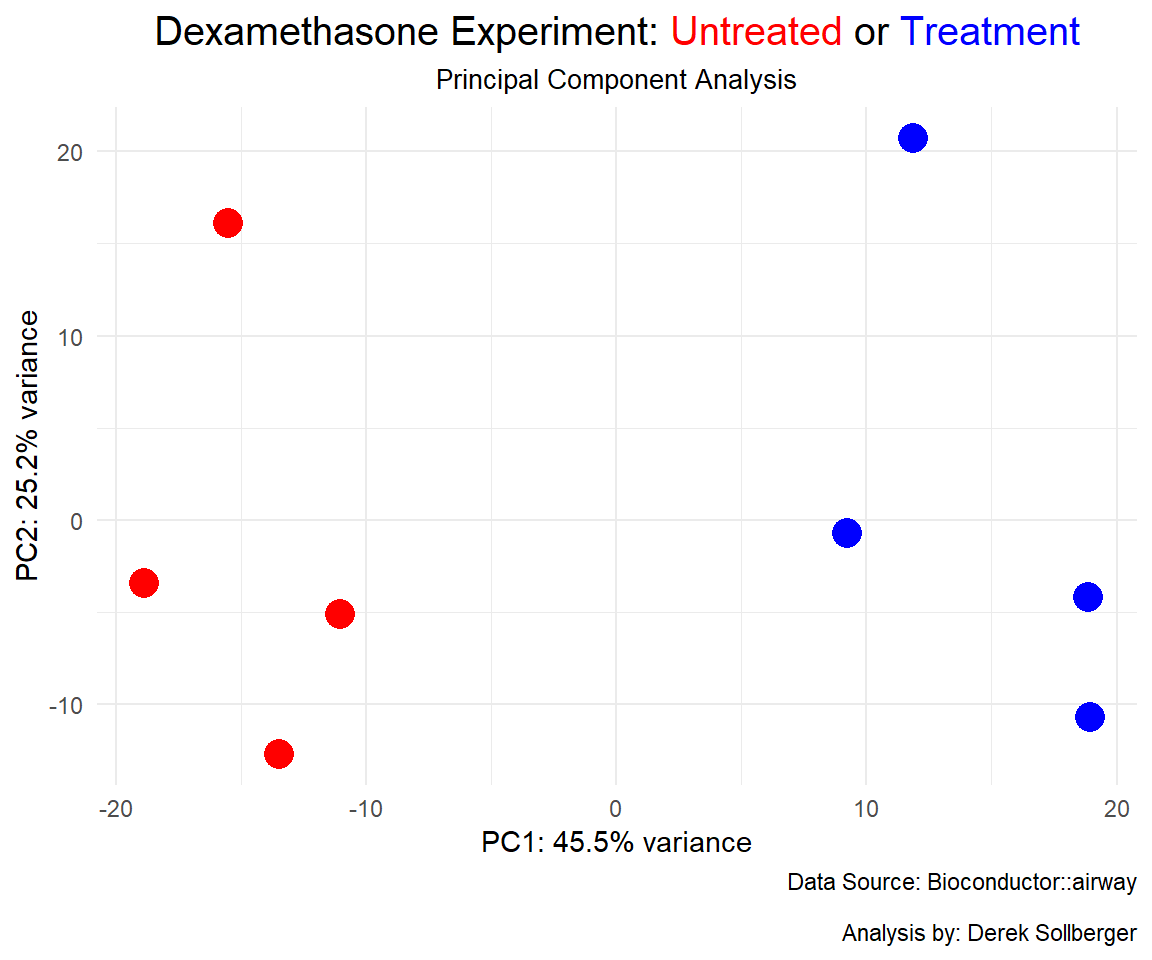
Principal Component Analysis
Across scans of various genes, we have a high-dimensional matrix of counts. In hopes of seeking out patterns, we can perform principal component analysis (PCA) and project the data into a lower dimensional space and see if there are perhaps some clusters there. Here, we retain the first two principal components that may already capture the majority of the variance and also is easy to visualize.
In this example of PCA, the treated cell lines and the untreated cell lines are clearly separated by the first principal component. This gives us some encouragement that the medical intervention is indeed affecting these lung cells.
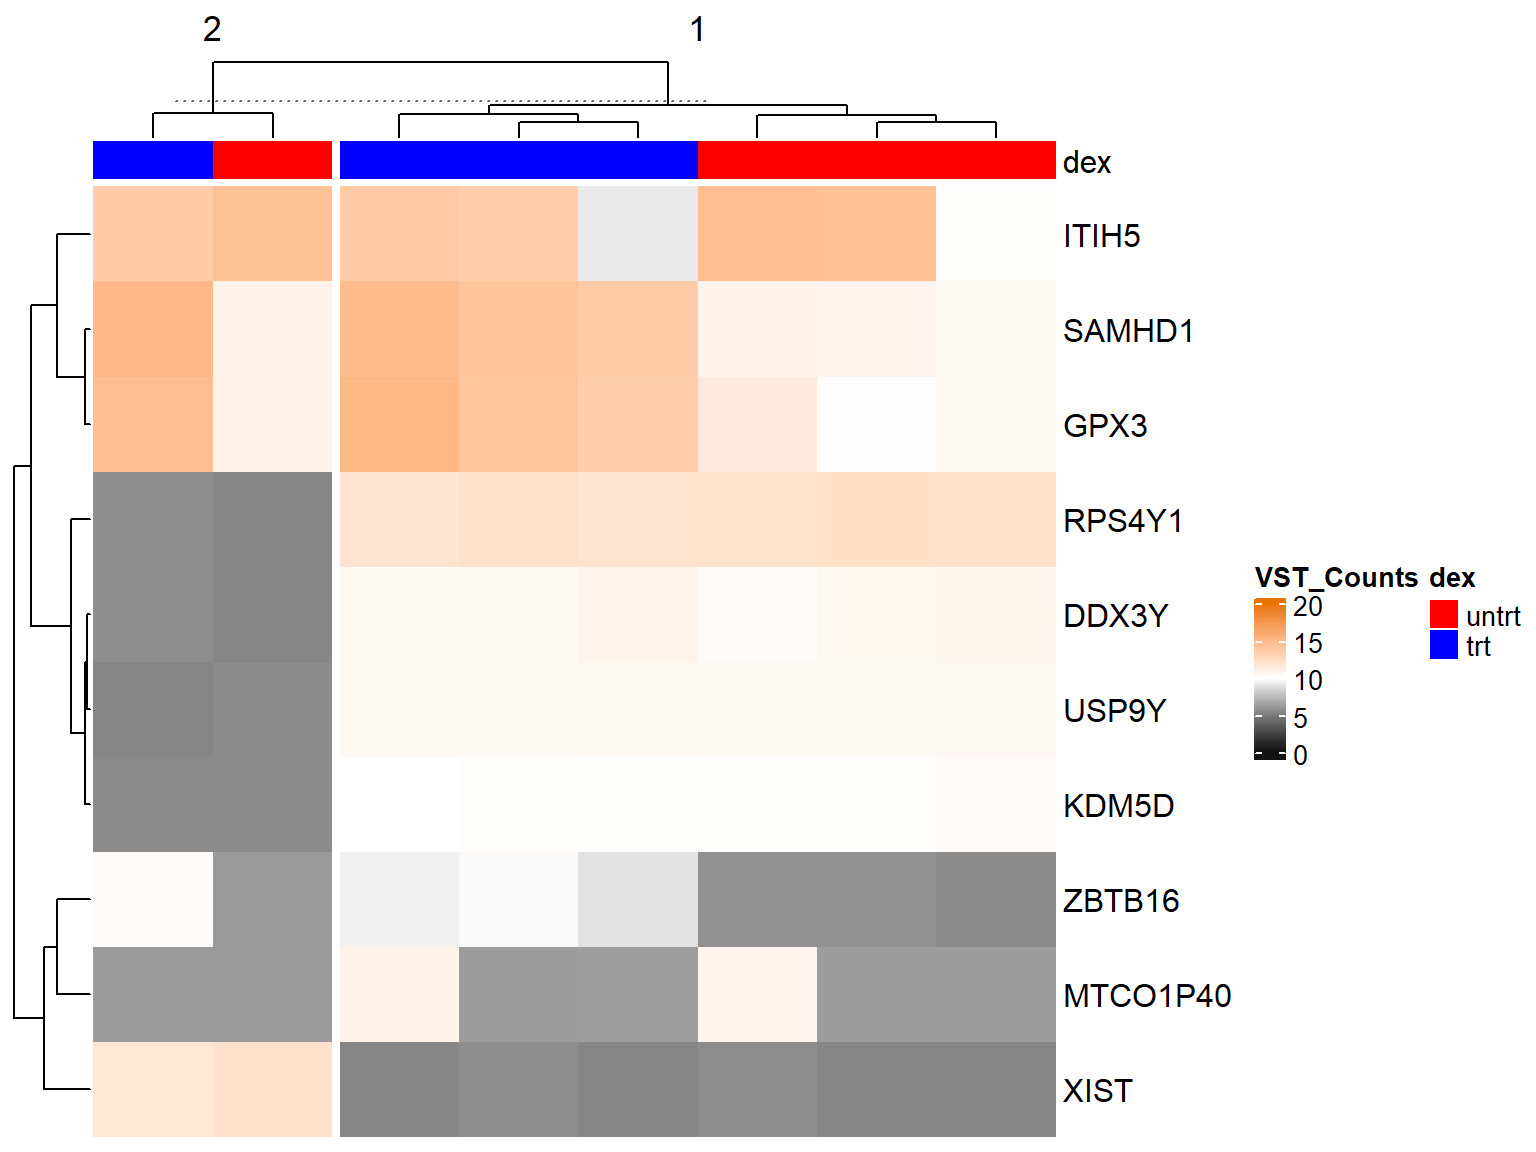
Hierarchical Clustering
Earlier, we used the DESeq function from Bioconductor to set us on the path toward differential expression analysis. For now, we take a numerical matrix of counts of the gene expression, compute the Euclidian distances between matrix entries, and organize the distances—starting with the shortest—in a process called hierarchical clustering. Like other clustering algorithms, we hope to use this unsupervised learning approach to encounter underlying structure in the data.
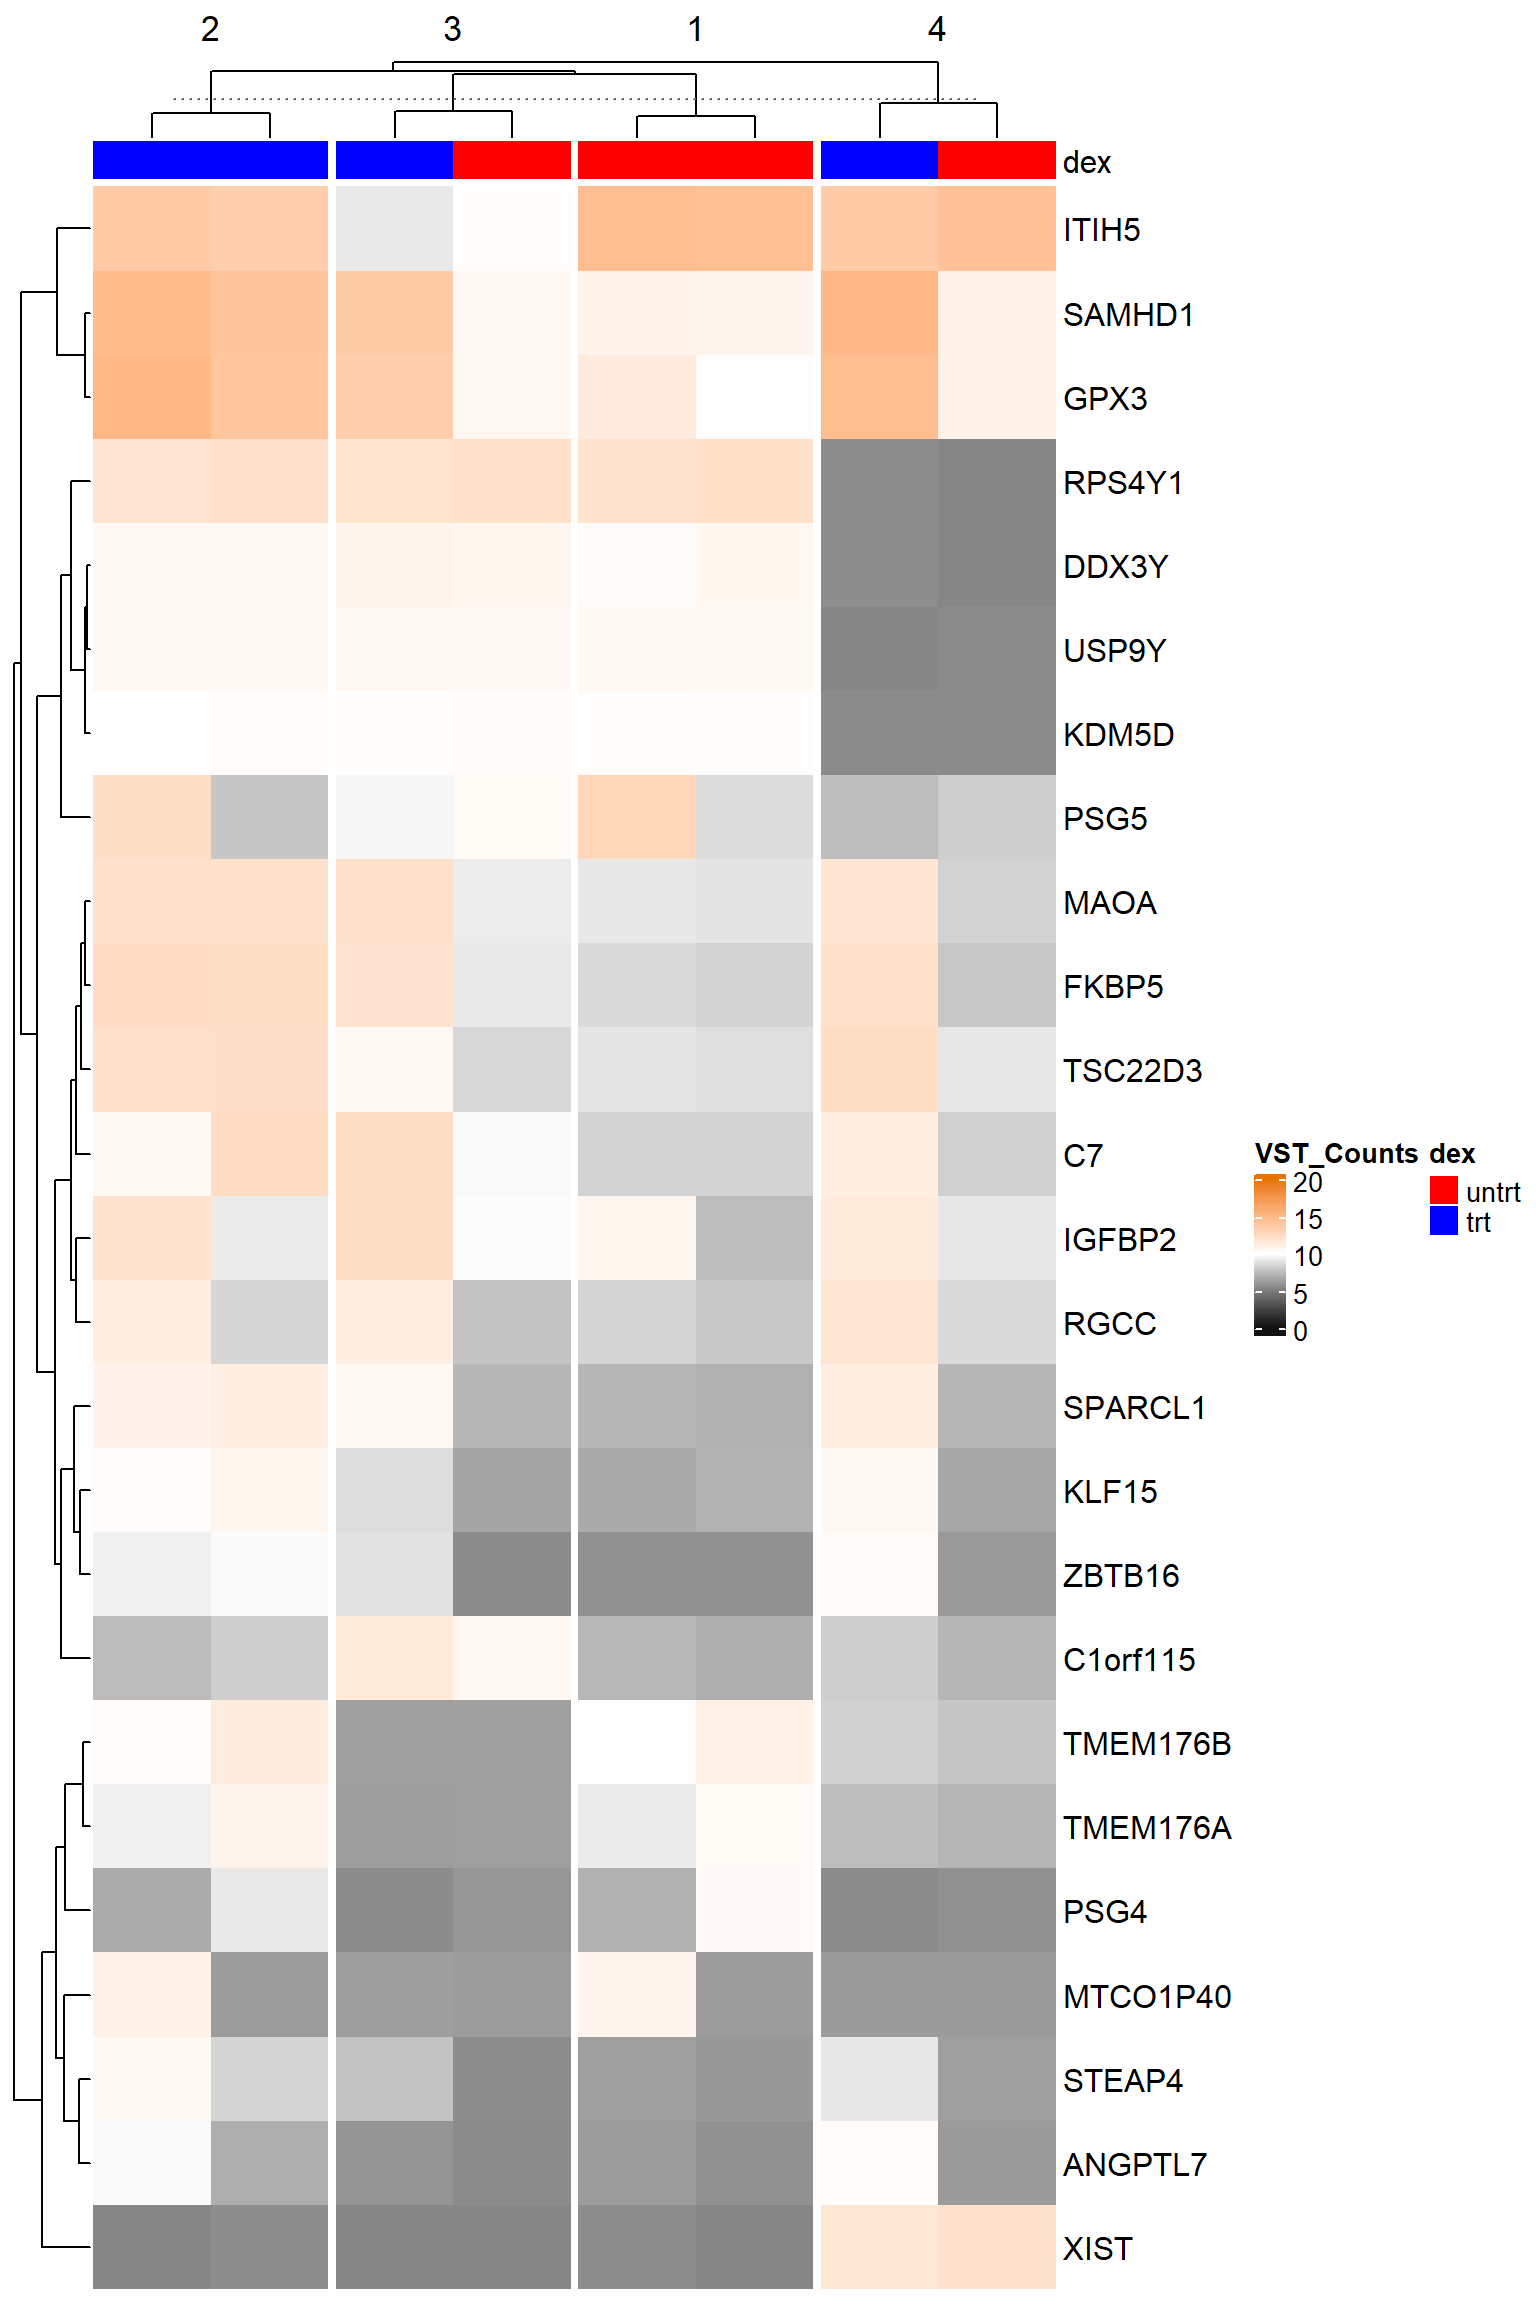
The Bioconductor community provides a ComplexHeatmap package to handle a lot of these ideas simultaneously. We start by assuming \(k = 2\) clusters and cut off the dendrogram (treemodel) where there would be 2 clusters. Upon looking at the annotation (here: the Dexamethasone treatment), we don’t seem to have discerning patterns at 2 clusters.
Tweaking the exploration up to \(k = 3\) and then \(k = 4\) clusters, we now have some clusters that separate the genes that may be affected differently from the Dexamethasone treatment. In the search for more expressed or less expressed genes, we have respectively candidates
- up-regulated genes: ITIH5, SAMHD1, GPX3
- down-regulated genes: RPS4Y1, DDX3Y, USP9Y, KDM5D
Of course, this is a tutorial data set and exploration. A more complex data set might display clustering better.
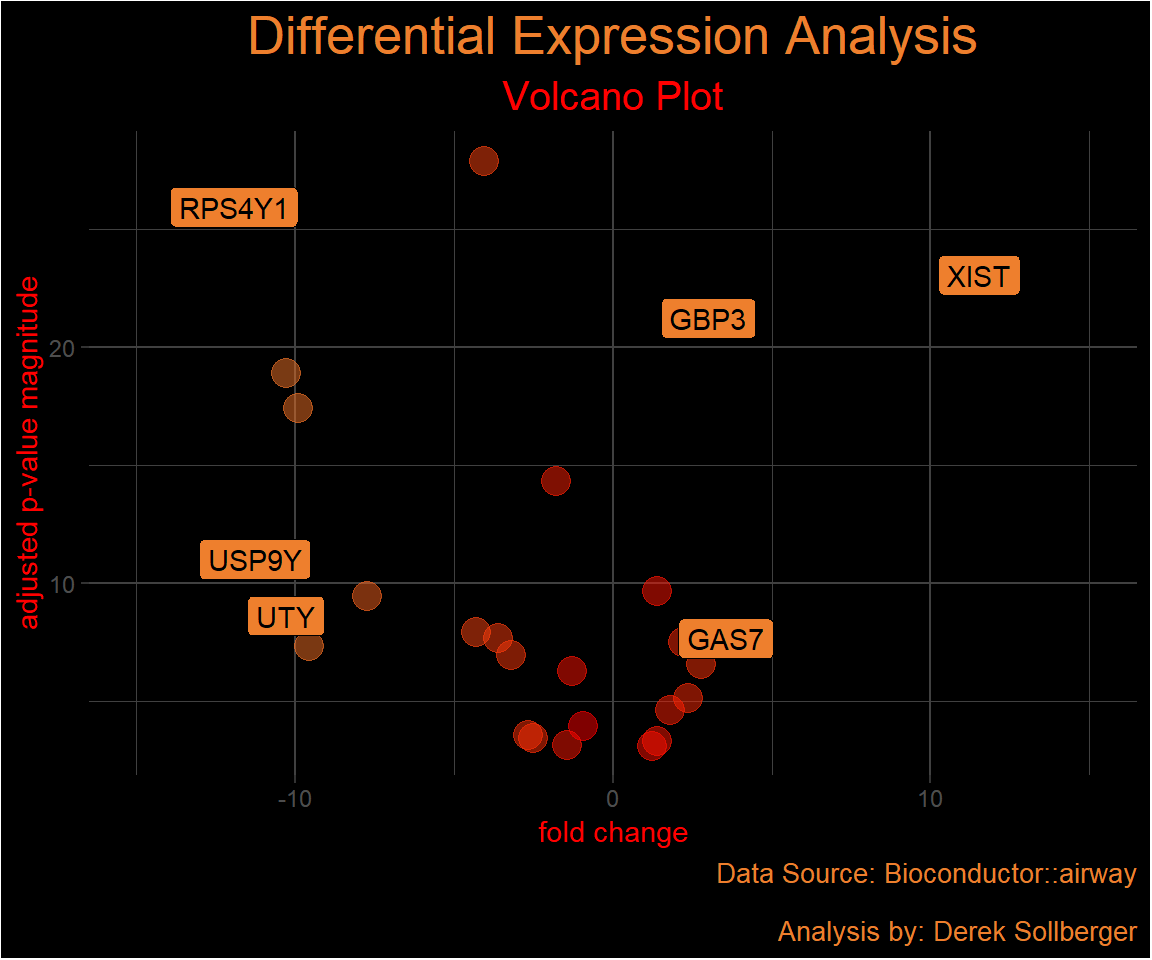
Differential Expression Analysis
It appears that the main bioinformatics technique in RNA-Seq is differential expression analysis. After normalizing the data (understanding sequence lengths and number of reads), we compare group means and overall means like in statistical tests. Here, I focus on \(\log_{2}\) fold change to discuss the less expressed or more expressed genes.
Results
In these calculations, the differential expression analysis yielded
- up-regulated genes: XIST, GAS7, GPB3
- down-regulated genes: RPS4Y1, USP9Y, UTY
where we have also noted that RPS4Y1, USP9Y were highly less expressed in the hierarchical clustering. Gene RPS4Y1 is involved in protein syntheis and may be related to cancer growth. Gene USP9Y is involved in protein turnover and has been associated with lung cancer. It appears that the dexamethasone steroid suppressed these genes.
Among the more expressed genes, it appears that the dexamethasone steroid activated GPB3 in particular. That gene may affect energy metabolism in lung cells.