library("dplyr")
library("ggplot2")
library("stringr")

df <- readr::read_csv("script.csv")Frasier
Frasier was a TV show back in the 1990s. Sometimes my friends and I rewatch the show out of nostalgia. In the past few years, Sulabh Bista parsed the episode scripts that were compiled by KACL.net, and that allows us hobbyist data analysts to seek insights.
Prompt 1
A friend asked
You should create a graph to show the frequency of references to Frederick in Frasier. I feel it falls to near zero after the first half of the first season
Let’s go!
df_Frederick <- df |>
  mutate(dialog = stringr::str_to_lower(dialog)) |>
  mutate(mentioned_Frederick = stringr::str_count(dialog, "frederick"),
         mentioned_Freddie = stringr::str_count(dialog, "freddie")) |>
  group_by(Season, Episode) |>
  mutate(n_Frederick = sum(mentioned_Frederick, na.rm = TRUE) +
           sum(mentioned_Freddie, na.rm = TRUE)) |>
  ungroup() |>
  select(Season, Episode, n_Frederick) |>
  distinct()
# https://r-charts.com/correlation/heat-map-ggplot2/
df_Frederick |>
ggplot(aes(x = Episode, y = reorder(Season, desc(Season)),
fill = n_Frederick)) +
geom_tile(color = "#cccccc",
lwd = 1.5, linetype = 1) +
geom_text(aes(label = n_Frederick), color = "black", size = 3) +
coord_fixed() +
labs(title = "How often do we hear about Frederick?",
subtitle = "Frasier TV show (1990s)",
caption = "Derek Sollberger\nSource: KACL.net",
x = "episode number", y = "season") +
scale_fill_gradient(low = "white", high = "#08872B") +
theme_minimal()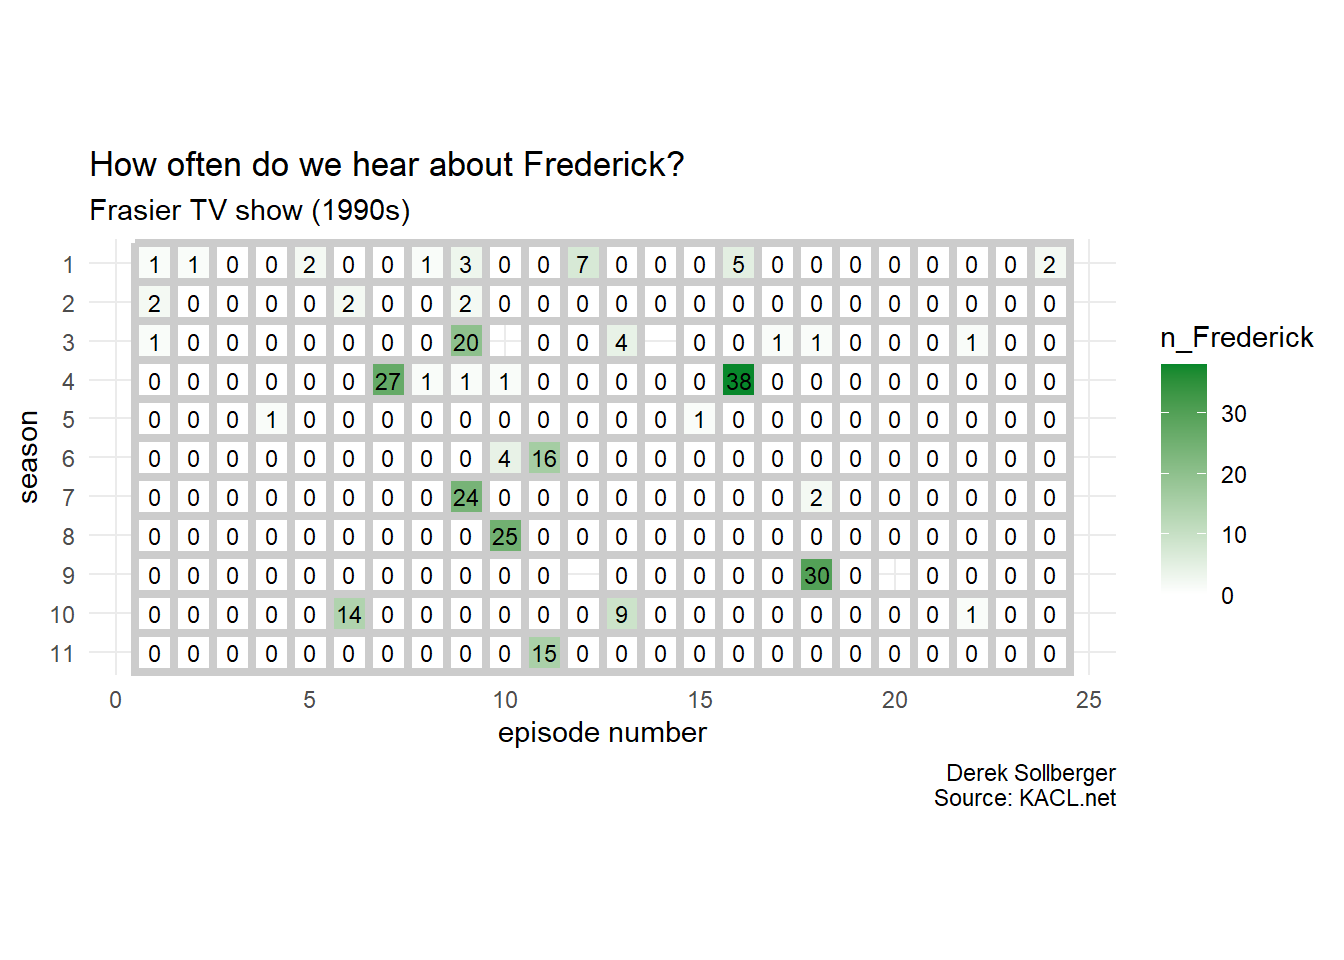
Perhaps a log transformation would get more contrast.
df_Frederick |>
  mutate(log_Frederick = log(n_Frederick + 1)) |>
  ggplot(aes(x = Episode, y = reorder(Season, desc(Season)),
             fill = log_Frederick)) +
  geom_tile(color = "#cccccc",
            lwd = 1.5, linetype = 1) +
  geom_text(aes(label = n_Frederick), color = "black", size = 3) +
  coord_fixed() +
  labs(title = "How often do we hear about Frederick?",
       subtitle = "Frasier TV show (1990s)",
       caption = "Derek Sollberger\nSource: KACL.net",
       x = "episode number", y = "season") +
  scale_fill_gradient(low = "white", high = "#08872B") +
  theme_minimal()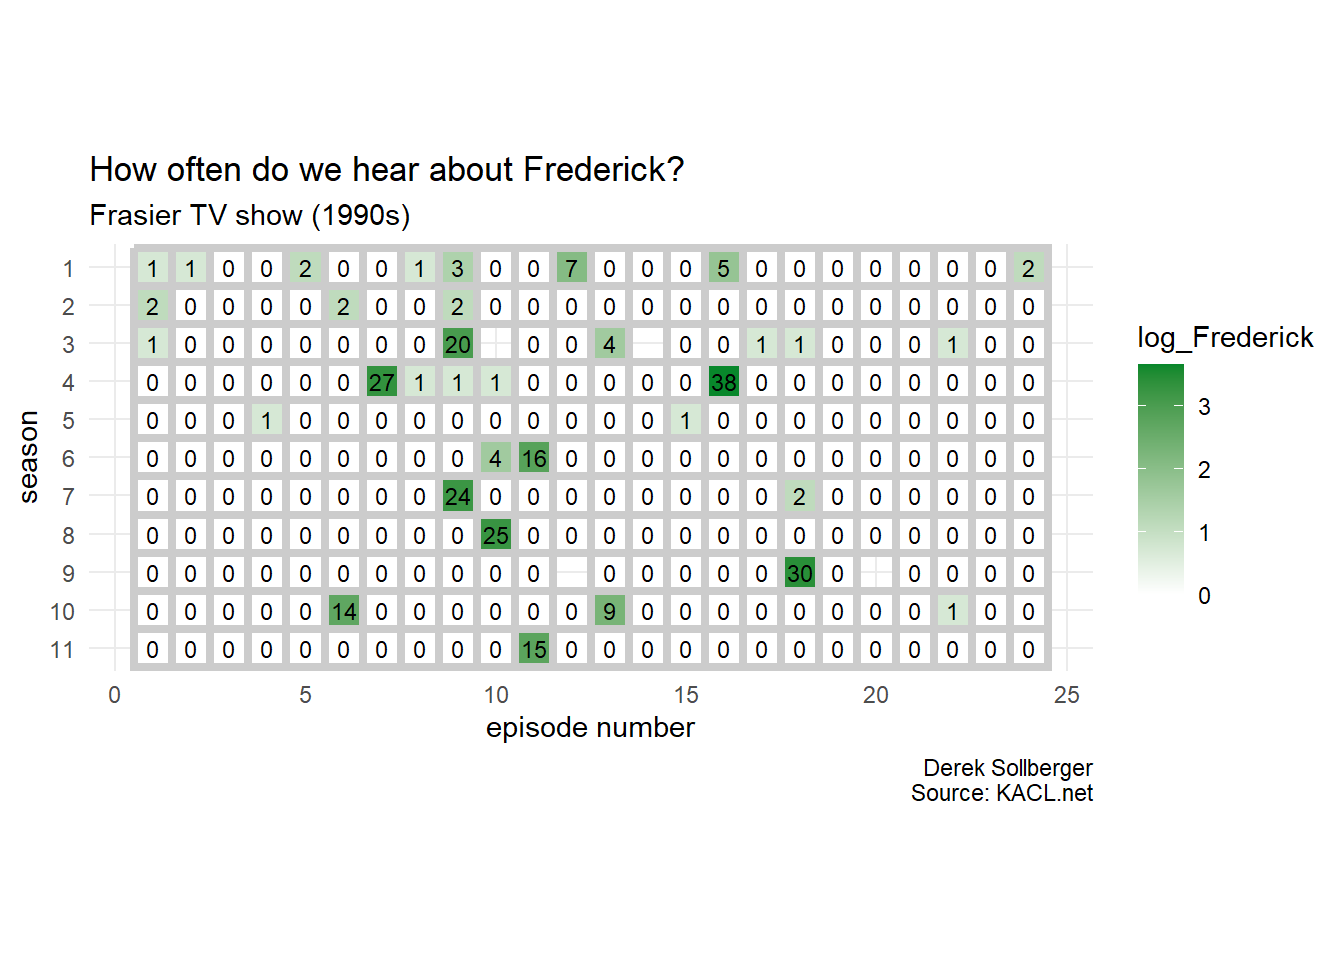
Session Info
sessionInfo()R version 4.5.1 (2025-06-13 ucrt)
Platform: x86_64-w64-mingw32/x64
Running under: Windows 10 x64 (build 19045)
Matrix products: default
LAPACK version 3.12.1
locale:
[1] LC_COLLATE=English_United States.utf8
[2] LC_CTYPE=English_United States.utf8
[3] LC_MONETARY=English_United States.utf8
[4] LC_NUMERIC=C
[5] LC_TIME=English_United States.utf8
time zone: America/New_York
tzcode source: internal
attached base packages:
[1] stats graphics grDevices utils datasets methods base
other attached packages:
[1] stringr_1.5.1 ggplot2_4.0.0 dplyr_1.1.4
loaded via a namespace (and not attached):
[1] bit_4.6.0 gtable_0.3.6 jsonlite_2.0.0 compiler_4.5.1
[5] crayon_1.5.3 tidyselect_1.2.1 parallel_4.5.1 scales_1.4.0
[9] yaml_2.3.10 fastmap_1.2.0 readr_2.1.5 R6_2.6.1
[13] labeling_0.4.3 generics_0.1.4 knitr_1.50 htmlwidgets_1.6.4
[17] tibble_3.3.0 pillar_1.11.0 RColorBrewer_1.1-3 tzdb_0.5.0
[21] rlang_1.1.6 stringi_1.8.7 xfun_0.52 S7_0.2.0
[25] bit64_4.6.0-1 cli_3.6.5 withr_3.0.2 magrittr_2.0.3
[29] digest_0.6.37 grid_4.5.1 vroom_1.6.5 rstudioapi_0.17.1
[33] hms_1.1.3 lifecycle_1.0.4 vctrs_0.6.5 evaluate_1.0.4
[37] glue_1.8.0 farver_2.1.2 rmarkdown_2.29 tools_4.5.1
[41] pkgconfig_2.0.3 htmltools_0.5.8.1